The US Light WTI Crude oil holds hold at $85/barrel as global concerns maintain demand for crude unchanged.
WTI Highlights
The Gaza truce standoff fuels concerns about long-term Middle Eastern oil disruptions.
The growth in US petroleum inventories clashes with geopolitical tensions in the price of WTI oil.
the Mexican Pemex exporting cut raises worldwide supply chain fears.
The market for WI crude oil faces stress due to conflicts in the Gaza and Mid East.
The price of crude rose on Wed following falling for the previous two consecutive days. The rise is partly due to the ongoing standstill in Palestine truce exchanges. Which has raised worries regarding the region’s oil supply security. Notwithstanding the gain, each benchmarks’ values are around 1.7 percent below what they were towards the conclusion of the previous week.
Near-Term Price The pattern: Positive
Given the elevated global concerns, notably the ongoing Gaza war and possible neighborhood promotion. In addition to supply chain limitations by Pemex with excess stocks in the USA. The immediate outlook for the price of oil is optimistic. Any more aggravation in the region’s conflicts, as well as unanticipated international developments. It might cause the price of crude to rise sharply. Furthermore, the US EIA forecasts a slight spike in Brent oil costs in 2024. Supporting the optimistic picture during the short term.
WTI Technical Outlook
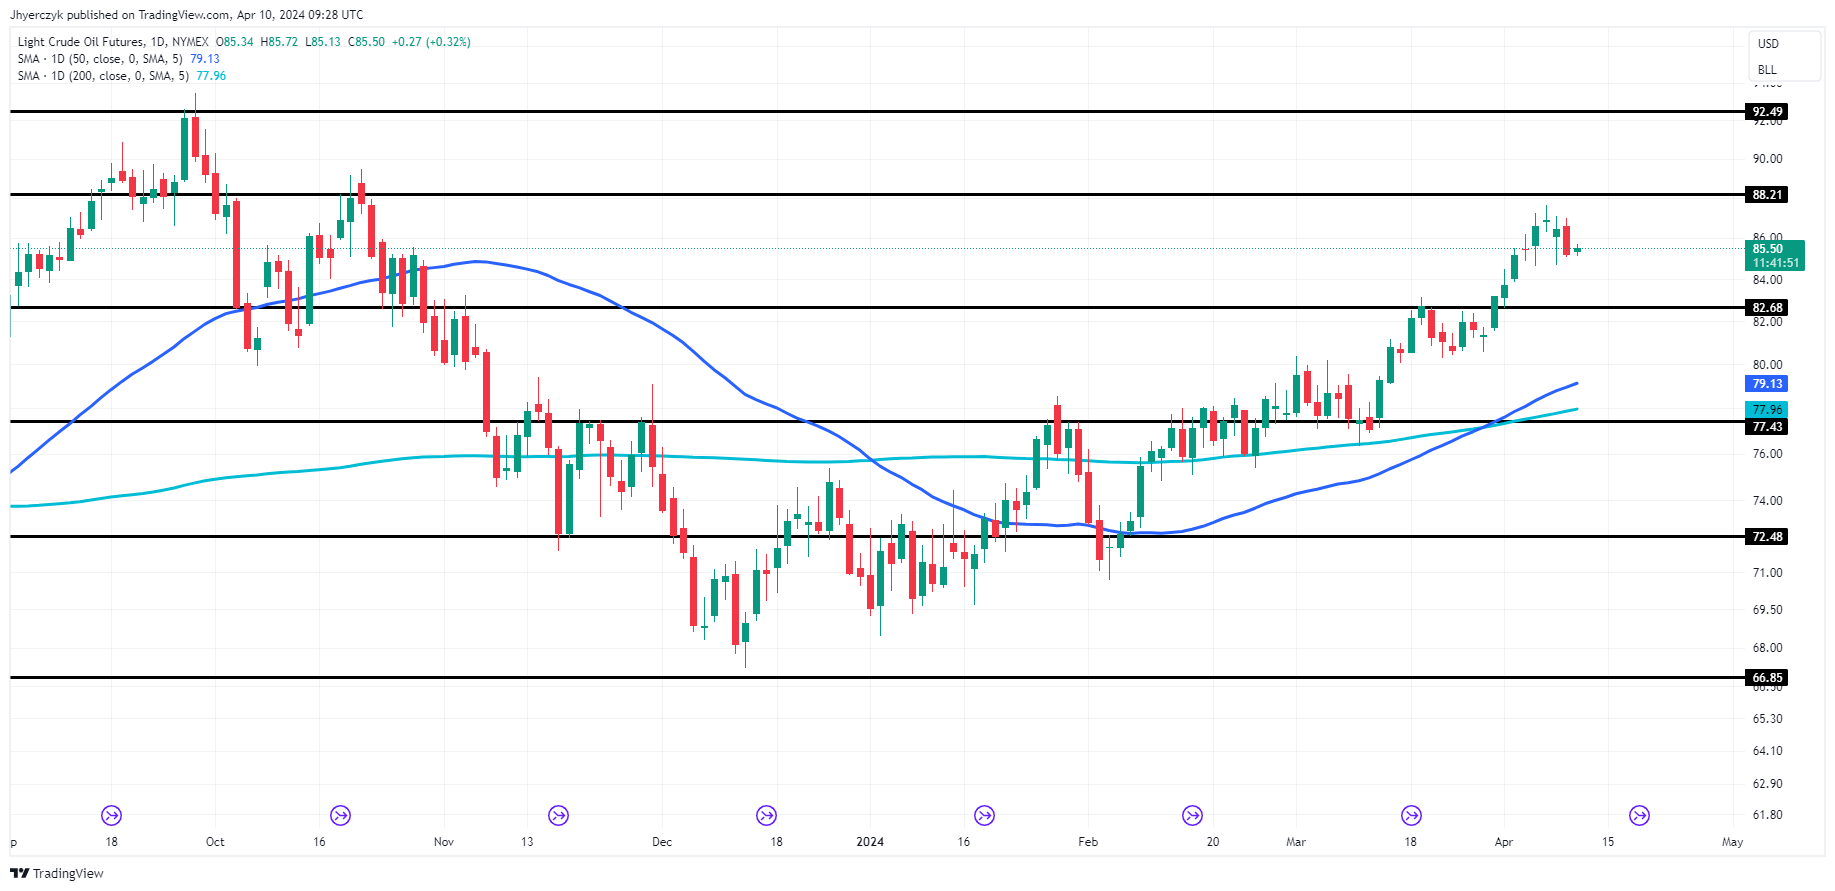
US WI oil futures remain continuing their upswing, although price activity during the last four days signals a decrease. Until fresh favorable news emerges. The danger of a truce among Palestine and Israelis appears to be limiting progress.
The immediate band comprises $80.30 through $87.63, with $83.96/bbl as a possible bearish objective.

Source: TradingView
Whereas trading over $80.30 mark implies the restoration of the current rising trend. An advance over $87.63 mark will tip the immediate trend onto the downside. However, investors need not be wary of a prolonged downturn. Which is emerging owing to significant supports near $79.13 – $77.96 mark, or as the 50 & 200 D- MAs, accordingly.
Daily Technical Indicators
| Name | Value | Action |
| RSI(14) | 50.031 | Neutral |
| STOCH(9,6) | 61.229 | Buy |
| STOCHRSI(14) | 87.325 | Overbought*Caution |
| MACD(12,26) | -0.100 | Sell |
| ADX(14) | 49.811 | Buy |
| Williams %R | -31.579 | Buy*Caution |
| CCI(14) | 143.5088 | Buy |
| ATR(14) | 0.2386 | Less Volatility |
| Highs/Lows(14) | 0.1014 | Buy |
| Ultimate Oscillator | 58.142 | Buy*Caution |
| ROC | 0.375 | Buy |
| Bull/Bear Power(13) | 0.3440 | Buy* |
| Name | Type | 5 Minutes | 15 Minutes | Hourly | Daily |
| WTI Crude
85.58 |
Moving Averages: | Strong Sell | Strong Sell | Sell | Buy |
| Indicators: | Strong Sell | Sell | Strong Buy | Strong Buy | |
| Summary: | Strong Sell | Strong Sell | Neutral | Strong Buy |


