WTI draws a few traders to a near 5-month peak of $85.00 on Middle Eastern war escalation and supply concerns
Highlights
US WTI rose to $84.85, a 5-month top, on Wed.
International uncertainty in the region of the Middle East, along with supplies concerns, pushed up the cost of oil.
The Federal Reserve’s dovish views have caused the U.S. dollar to weaken, lifting WTI rates.
The Market Snapshot
This Wed, the US WTI reached its highest level as of the end of 2023, hovering at $84.85 mark. The lower US currency along with supply concerns in the midst of global instability are driving higher WTI pricing.
The growing geopolitical conflicts in the Middle Eastern region, along with Russia-Ukraine. Which among them the Israeli strike targeting the Iran’s consulate in Syrian territory on Mon. the continuing Ukrain assaults on Russia’s factories. While the Yemeni Houthi strikes on shipment in the Red Sea, increase fears of increased tightening goods, and this increase WTI crude oil prices rates.
Crude markets will be watching the upcoming Joint OPEC & non-OPEC Ministers Monitor Council (JMMC) meet on Wed. Investors anticipate the OPEC+ group to prolong volunteer reductions beyond the Q2 during this year.
Aside from that, crude reserves in the United States declined by 2.286 mil barrels in the period ended the 29th of March. Following a 9.337 mil barrel increase the week before, revealed by API published Tue.
WTI Technical Analysis
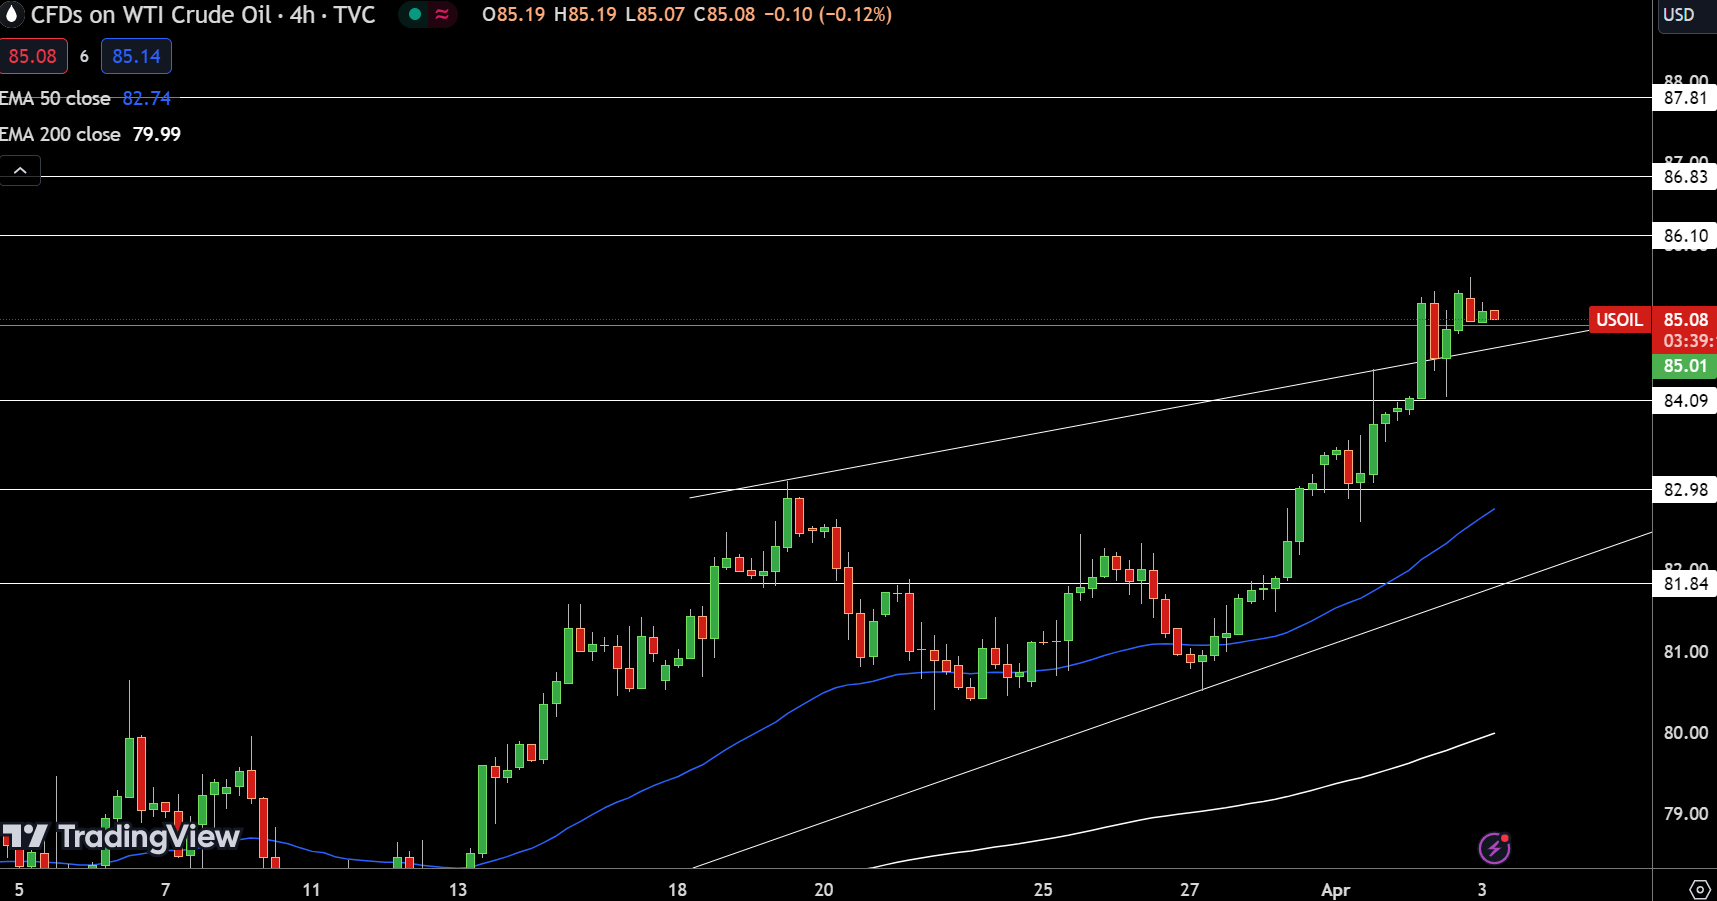
The current price of WTI Crude is $85.08, representing a 0.35 percent decrease. The market is hanging at the turning point of $85.01 mark. Making it critical for today’s trade approach. The levels of resistance have been formed on $86.10, $86.83, then $87.81 mark, threatening the bull trend.

Source: TradingView
Supporting levels of $84.09, $82.98, & $81.84 offer risk mitigation. The 200 D- EMA around $79.99 support a positive attitude. Implying additional increases over the $85.01 the pivot point, plus a possibility of a drop should the trading price falls under this crucial mark.
Technical Indicators & Signals
| Name | Value | Action |
| RSI(14) | 57.972 | Buy |
| STOCH(9,6) | 52.413 | Neutral |
| STOCHRSI(14) | 15.023 | Oversold |
| MACD(12,26) | 0.210 | Buy |
| ADX(14) | 18.516 | Neutral |
| Williams %R | -51.316 | Neutral |
| CCI(14) | 12.1363 | Neutral |
| ATR(14) | 0.2329 | Less Volatility |
| Highs/Lows(14) | 0.0000 | Neutral |
| Ultimate Oscillator | 56.459 | Buy |
| ROC | 0.035 | Buy |
| Bull/Bear Power(13) | 0.1440 | Buy |
Daily Pivots
| Name | S3 | S2 | S1 | Pivot Points | R1 | R2 | R3 |
| Classic | 84.52 | 84.69 | 84.94 | 85.11 | 85.36 | 85.53 | 85.78 |
| Fibonacci | 84.69 | 84.85 | 84.95 | 85.11 | 85.27 | 85.37 | 85.53 |
| Camarilla | 85.07 | 85.11 | 85.15 | 85.11 | 85.23 | 85.27 | 85.31 |
| Woodie’s | 84.56 | 84.71 | 84.98 | 85.13 | 85.40 | 85.55 | 85.82 |
| DeMark’s | – | – | 85.03 | 85.15 | 85.44 | – |


