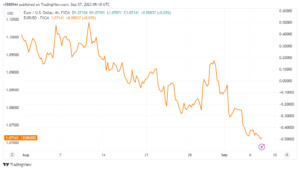
EURUSD is struggling to break away from 1.0700.
The EURUSD gained ground during European trading hours on Wednesday. But it was unable to extend its gains in the second part of the day. As the US Dollar (USD) maintained its resilience. The pair remains on the back foot early Thursday. Trading within striking distance of 1.0700.
According to the ISM Services PMI data released on Wednesday. Business activity in the US service sector rose faster than predicted in August. The publication demonstrated that employment grew further, while price pressures escalated during the time. With markets reassessing the likelihood of the Federal Reserve hiking policy rates another time this year. The 10-year US Treasury bond yield continued to rise, providing support to the USD.
Markets will be watching Fedspeak and US Jobless Claims data closely.
The risk-averse market mood, as indicated by dropping US stock index futures. Prevents EURUSD from staging a technical correction early Thursday.
The weekly Initial Jobless Claims will be presented on the US economic docket in the second half of the day. A significant drop in the number of first-time applicants for unemployment benefits of 20,000 or more could help the USD continue to outperform its rivals.
Market participants will also pay close attention to Federal Reserve statements. . The Fed’s blackout period begins on Saturday, and policymakers have two more days. To influence market expectations in a particular direction.
“The risk of inflation remaining higher for longer must now be balanced against the risk that an overly restrictive monetary policy stance will result in a greater slowdown in activity than is required to restore price stability,” said Susan Collins, President of the Federal Reserve Bank of Boston, on Wednesday. If more authorities take a similarly cautious approach to any policy tightening, the USD’s upside could be limited.
EURUSD Technical Analysis
The EURUSD pair is trading in the lower part of the descending regression channel, and the four-hour chart’s Relative Strength Index (RSI) indicator is far below 40. highlighting the bearish bias.
On Tuesday and Wednesday, 1.0700 served as a support level. If buyers abandon their defense of this level, further losses toward 1.0635 (May 31 low) and 1.0600 (psychological level, static level) are possible.

On the upside, 1.0740 (the descending channel’s midpoint) serves as temporary resistance before 1.0760 (the static level). A four-hour close above the latter might pave the way for a comeback toward 1.0780 (the upper limit of the descending channel) and 1.0800 (the 50-period Simple Moving Average, the psychological level).


