EURUSD is affected by tensions between the United States and China.
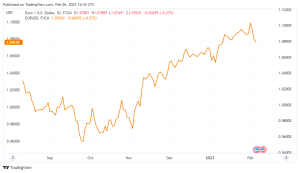
The EURUSD exchange rate declined to a level of 1.0750, which is the lowest since early January. The gloomier atmosphere is exacerbated by growing US Secretary of State Blinken’s upcoming trip to China was postponed after a rumored Beijing spy balloon that was flying over American airspace was shot down.
At the start of the new week, risk aversion rules the financial markets, driving up the US Dollar across the board of FX. Following the publication of a positive January Nonfarm Payrolls data, the value of the American dollar increased on Friday. In spite of a rise in the labor force participation rate to 62.4%, the country gained 517K new jobs in the month, exceeding forecasts.
The unemployment rate also decreased to 3.4%. The USD increased on expectations that the US Federal Reserve will keep raising rates in the coming months, lessening the likelihood of a rate decrease by year’s end.
The data from Europe were poor. On the one hand, Germany released December Factory Orders data that showed a far worse-than-expected 10.1% YoY decline. On the other hand, retail sales in the Euro Zone decreased by 2.8% from a year ago and 2.7% month over month in January. On Monday, no pertinent statistics will be released by the US. Tensions between the United States and China. President Joe Biden spoke on Friday.
EURUSD Technical Outlook
The EURUSD pair is trading in a narrow range at about 1.0770, down for the day. A few ticks above a crucial support level, the 61.8% retracement of the 2022 fall at 1.0745, the pair bottomed out at 1.0756. On the daily chart, the pair is presently moving below a flat 20 SMA, and at about 1.0320, a bullish 100 SMA is crossing over a directionless 200 SMA. As a result of the extended selling halt, technical indicators have now gone flat around their midlines.

The risk is still tilted to the negative in the short run and according the 4-hour chart. A somewhat bullish 200 SMA that converges with the intraday low and develops below the 20 and 100 SMAs is where the pair found buyers shorter one moving downhill faster.
Technical indicators, which had begun to decline after reaching oversold readings, stopped and are now close to their daily lows. A break below the aforementioned Fibonacci support level will enhance the chance of a harsher loss, with potential for the decline to continue below the 1.0600 price region.


