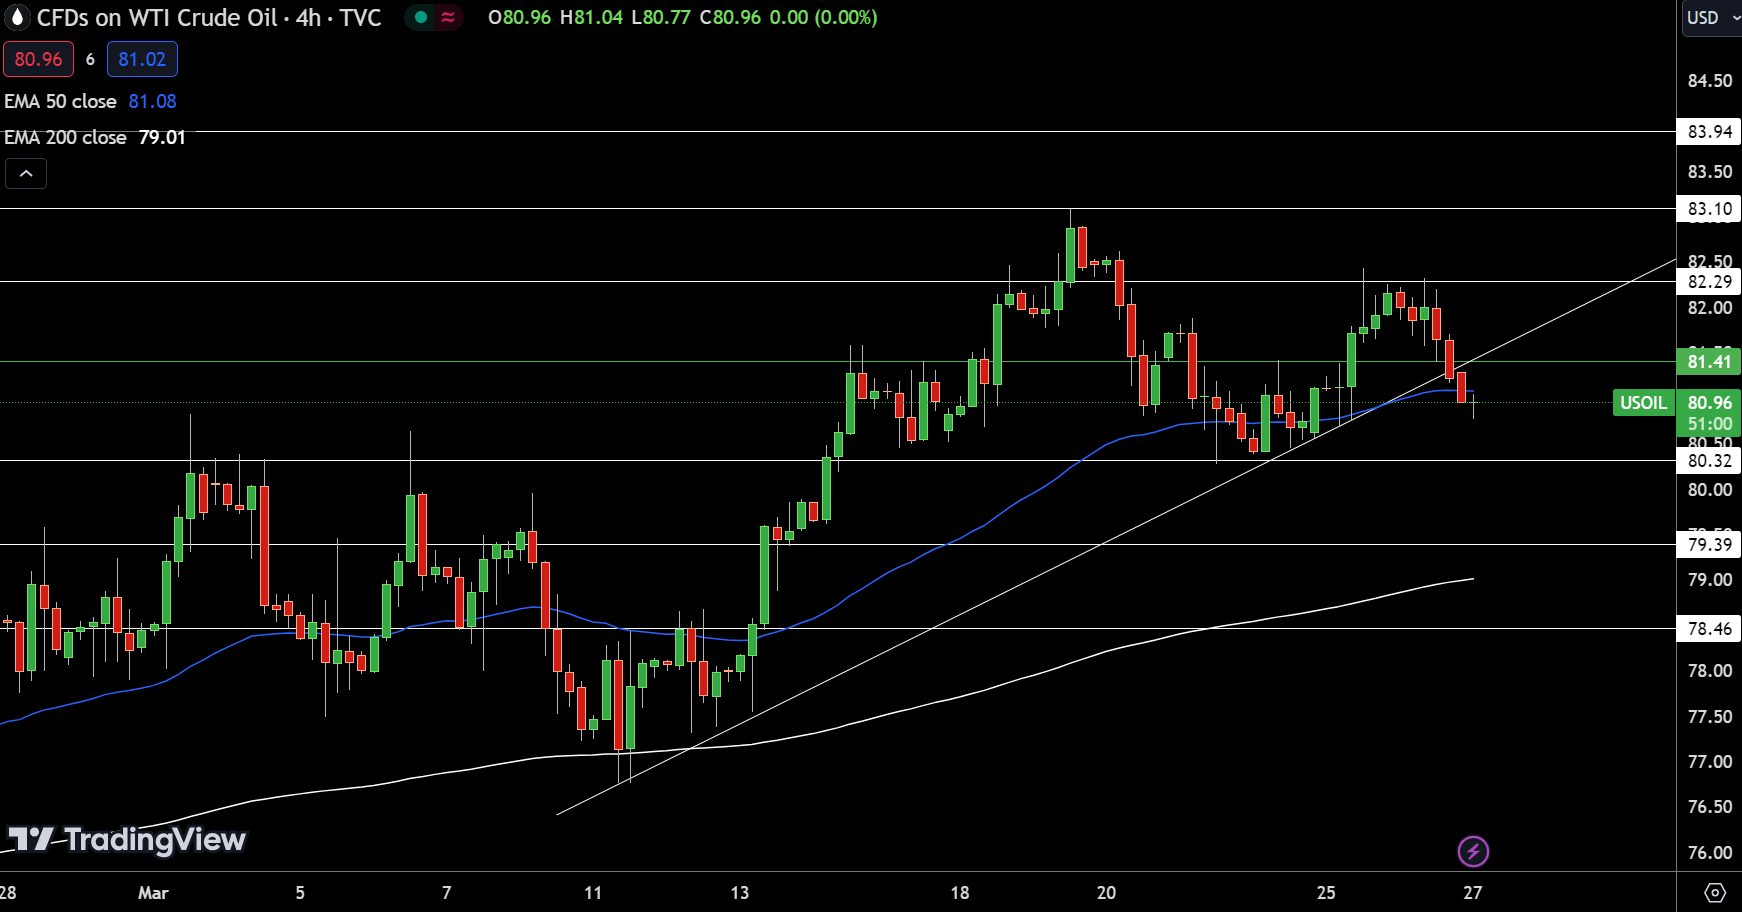
The US WTI Crude, has been trading at roughly $80.85 on Wed. WTI Crude values fall despite a minor recovery in the USD. With conflicting reactions to the shuttering of Russian refining output following current Ukrain hostilities.
WTI Crude and Natural Gas (NG) Highlights
US WTI oil stocks rise by 9.3 mil barrels, pushing the price of oil down.
The OPEC+ is projected to sustain production curbs until June, complicating pricing estimates.
The price of natural gas and WTI oil prices are somewhat lower as stocks fluctuate and OPEC+ measures are implemented.
The market Snapshot
The price of crude fell for an additional day in a row, impacted by a big increase in US crude inventories. And hopes that OPEC+ will continue its present production strategy at the forthcoming summit. Market trends point to prospective adjustments, including a 9.3 mil barrel of oil rise in US. crude stockpiles. With a minor gain in distilled inventory, offset with a 4.4 mill bls decline in petrol stockpiles.
The OPEC+’s planned continuation of ongoing production reductions until June. Given compliance issues, further changes the crude oil market’s conditions. Such occurrences, together with varying levels of stocks, highlight a complicated scenario for crude and perhaps gas predictions. When market players assess OPEC+ tactics with the US storage implications.
WTI Analysis
WTI trades at $80.96, a small decline of 0.39 percent. The important pivot mark of $81.41. Which marks a crossroads for prospective price shift pathways. The levels of resistance have been identified at $82.29, $83.10, then $83.94 mark, suggesting the limits for upward advances.
Supporting levels such as $80.32, $79.39, & $78.46 mark, on the other hand, offer probable retreat situations. The 50 & 200 D-EMAs, near $81.08 & $79.01, each, send varying signals.

Source: TradingView
The market’s general posture for WTI is negative under the $81.41 the pivot point, implying that caution is advised. Alongside the possibility of an upswing if the price breaks over this critical area.
Brent Crude Analysis
Brent oil is down 0.41 percent, trading at $84.94 mark. The pivot the mark, $85.51, marks probable changes in market mood. The levels of resistance have been detected at $86.46, $87.29, then $88.40 level, showing locations wherein growth may encounter obstacles.
Supporting is located at $84.56, adding additional levels at $83.79 & $82.99, which might stem falls. The 50 & 200 D-EMAs, near $85.45 & $83.51, accordingly, imply an unclear picture.
The market’s overall stance for Brent is now negative under $85.51 mark. Though a crossing over this point potentially signaling a turn for a positive attitude.
Natural Gas (NG) Analysis
The Natural gas prices have decreased by 0.39 percent, to $1.797 mark. The price is trading close beneath the pivotal level of $1.8080 mark. Showing that there is possibility for shifts in direction. The levels of resistance are seen in $1.8447, $1.8756, then $1.9035 mark. That may limit advances in the immediate run.
Supporting levels have been created around $1.7665, plus more bottoms around $1.7261 & $1.6795 level. It maybe suggesting a decline. The 50 & 200 D-EMAs, near $1.8185 & $1.8927, each, indicate a larger negative mood. The natural gas price is negative under $1.8080 mark. Although a move over this critical level might signal a turn into an upward trend.
Technical Indicators & Signals – Daily
WTI Crude Oil
| Name | Value | Action |
| RSI(14) | 54.961 | Neutral |
| STOCH(9,6) | 52.495 | Neutral |
| STOCHRSI(14) | 25.819 | Sell |
| MACD(12,26) | 1.210 | Buy |
| ADX(14) | 34.515 | Sell |
| Williams %R | -41.785 | Buy |
| Name | Value | Action |
| CCI(14) | 20.9033 | Neutral |
| ATR(14) | 1.6543 | Less Volatility |
| Highs/Lows(14) | 0.0000 | Neutral |
| Ultimate Oscillator | 47.026 | Sell |
| ROC | 2.496 | Buy |
| Bull/Bear Power(13) | 0.1200 | Buy |
Natural Gas (NG)
| Name | Value | Action |
| RSI(14) | 50.335 | Neutral |
| STOCH(9,6) | 56.753 | Buy |
| STOCHRSI(14) | 100.000 | Overbought*Caution |
| MACD(12,26) | -0.072 | Sell |
| ADX(14) | 41.251 | Sell |
| Williams %R | -17.778 | Overbought |
| Name | Value | Action |
| CCI(14) | 90.8555 | Buy |
| ATR(14) | 0.1051 | Less Volatility |
| Highs/Lows(14) | 0.0207 | Buy*Caution |
| Ultimate Oscillator | 52.711 | Buy |
| ROC | -2.255 | Sell |
| Bull/Bear Power(13) | 0.1500 | Buy |


