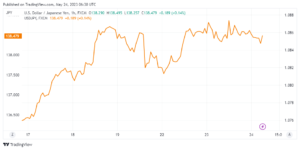
USDJPY’s bearish chart pattern is reaching its peak in six months.
USDJPY reached a new high since November 2022, following an uninspiring close the day before. As a result, the main currency pair is displaying a one-week-old rising wedge bearish chart shape.
According to Credit Suisse analysts, the USDJPY has made a robust move higher to break over major price and “neckline” resistance at 137.70/98, establishing an important foundation that will pave the way for a more significant advance higher.
Not only is there a bearish pattern, but there are also negative MACD signs and a failure to hold the multi-day high.
However, the Yen’s immediate fall is limited by the 100-Hour Moving Average (HMA) level of roughly 138.30., a breach of which indicates the confirmed wedge’s lower line near 138.00.

Following that, a rapid USDJPY drop to the 200-HMA at 137.20 cannot be ruled out. It should be noted, however, that the rising wedge confirmation suggests a theoretical goal of 136.00.
Alternatively, the indicated wedge’s top line, which was near to the 139.00 round number at the time of publication, limits immediate USDJPY recovery. The July 2022 high of about 139.40 is also anticipated to be a hurdle to Yen pair buyers.
Even if the Yen pair manages to break beyond the 139.40 barrier, the 140.00 round number may entice buyers.
Overall, the USDJPY bulls look to have peaked, but sellers are waiting for definitive indications.
USDJPY Technical levels
| Daily SMA20 |
136.03 |
| Daily SMA50 | 134.06 |
| Daily SMA100 | 133.29 |
| Daily SMA200 | 137.17 |
| Today last price | 138.43 |
| Today Daily Change | -0.15 |
| Today Daily Change % | -0.11% |
| Today daily open | 138.58 |


