On a strong USD, the AUDUSD loses only minor intraday gains. The pair is struggling to leverage its modest uptick in the face of reignited USD buying and hawkish Fed and higher US bond yields aid to restore USD demand.
AUDUSD pair has attracted some sellers. Following an increase to the mid-0.6700s
The prospect of further Fed tightening continues to support higher US Treasury yields and continues to act as a wind in the US dollar’s sails. In fact, markets seem to believe that the Federal Reserve will remain hawkish for longer amid persistent inflation.
The bets were confirmed by a stronger US PCE price index released last Friday, which suggested inflation was not easing as quickly as expected.
AUDUSD investors fear persistent higher
Most market participants continue to fear economic difficulties due to rapidly rising financing costs. Additionally, geopolitical tensions are dampening an overnight rally in equity markets. Furthering the supporting a safe-haven dollar and helping to limit growth in the risk-sensitive Aussie. This overshadows the better-than-expected Australian Retail Sales data and does little to help the AUDUSD pair.
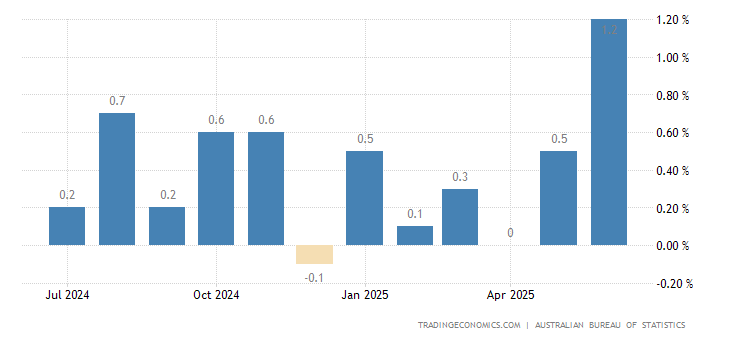
Indeed, the Australian Bureau of Statistics noted that retail sales increased by 1.9% in Jan, compared to market consensus of a 1.5% increase and a 3.9% decline the prior month.

Source: Australian Bureau of Statistics
| Calendar | GMT | Reference | Actual | Previous | Consensus | TEForecast | |
|---|---|---|---|---|---|---|---|
| 2023-02-06 | 12:30 AM | Retail Sales MoM Final | Dec | -3.9% | 1.7% | -0.6% | -3.9% |
| 2023-02-28 | 12:30 AM | Retail Sales MoM Prel | Jan | 1.9% | -4.0% | 1.5% | 1.5% |
| 2023-03-07 | 12:30 AM | Retail Sales MoM Final | Jan | -3.9% | |||
The failure of the Aussie-dollar duo to gain any meaningful traction in response to the upbeat domestic statistics. That shows that the downturn seen since the beginning of this month is still far from over. Bears, on the other hand, may be waiting for a sustained break just below 0.6700 points.
Investors Keenly watching economic reports
Traders are now turning their attention to US economic data, including the release of the regional manufacturing PMI and the Conference Board Consumer Confidence Index. This, combined with US bond yields and broader risk appetite, could weigh on US
The price momentum give AUDUSD some momentum later in the early North American session. Though, fundamentals, on the other hand, imply that the route of least resistance for spot rates is to the downtrend.
The Technical Perspective
AUDUSD – Small head and shoulders trigger the pair to fall below significant support on the mid-January horizontal trendline at 0.6870. Triggering a minor head and shoulders pattern (left shoulder high on 18th Jan.
The head is high on 2nd Feb and the right shoulder is high from Feb 14) with a target price of 0.6580. Importantly. The decline below the 200-day moving average (DMA) and the 89-DMA buffer confirms that the multi-week upward pressure has eased.
However, there is relatively strong support with the low in late November.6585. the pair needs to stay above support for the 4-month uptrend to remain intact.
The daily Moving Averages are showing a bearish tendency
The moving averages are now clearly in a downtrend and will serve as resistance for the sellers with the downtrend line. Typically, we can see a retracement or price action before the next impulse of the original trend.
The AUDUSD duo briefly fell below a mildly bullish 100 Simple Moving Average (SMA), which ended the day a few pips above according to the daily chart pattern.
Simultaneously, the 200 SMA begins to decline above the current level. In contrast, the 20 SMA accelerates south far ahead of the longer one. All at the same.
All at the same.
Key Technical Levels to Monitor.
| OVERVIEW | |
| Today last price | 0.6729 |
| Today Daily Change | -0.0010 |
| Today’s Daily Change % | -0.15 |
| Today daily open | 0.6739 |
| TRENDS | |
| Daily SMA20 | 0.6914 |
| Daily SMA50 | 0.6894 |
| Daily SMA100 | 0.673 |
| Daily SMA200 | 0.6799 |
| LEVELS | |
| Previous Daily High | 0.6745 |
| Previous Daily Low | 0.6698 |
| Previous Weekly High | 0.6921 |
| Previous Weekly Low | 0.6719 |
| Previous Monthly High | 0.7143 |
| Previous Monthly Low | 0.6688 |
| Daily Fibonacci 38.2% | 0.6727 |
| Daily Fibonacci 61.8% | 0.6716 |
| Daily Pivot Point S1 | 0.671 |
| Daily Pivot Point S2 | 0.6681 |
| Daily Pivot Point S3 | 0.6663 |
| Daily Pivot Point R1 | 0.6757 |
| Daily Pivot Point R2 | 0.6774 |
| Daily Pivot Point R3 | 0.6803 |


