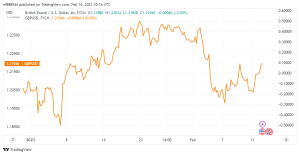
On Tuesday, the GBPUSD gained traction and reached a new five-day high over 1.2150. The near-term technical picture indicates a positive turn, but the market reaction to the US January inflation report will determine the pair’s next directional move.
US inflation data is expected to dominate the GBPUSD movement in the American session.
Earlier in the day, the UK’s Office for National Statistics revealed that the ILO Unemployment Rate stayed constant at 3.7% in the three months to December, reflecting market forecasts. According to the UK employment report, annual pay inflation, as measured by Average Earnings Excluding Bonus, increased to 6.7% in the same period from 6.5%.
The Pound Sterling gained momentum following the initial reaction, as investors interpreted the strong wage inflation figures as a potential cause that may push a rate hike. the Bank of England to maintain its restrictive monetary policy. Nonetheless, with market players concentrating on US data, the GBPUSD is unlikely to prolong its comeback based only on this data.
The Core Consumer Price Index (CPI) is expected to rise 0.4% on a monthly basis in January, according to the Bureau of Labor Statistics. At this stage, a reading in line with market expectations may not be enough to give the US Dollar a lift and allow the GBPUSD to keep its footing. The Bureau of Labor Statistics’ changes to the CPI basket and rising used vehicle prices at the start of the year are largely expected to boost monthly core inflation in January.
The market’s initial reaction to a monthly Core CPI If the reading falls below the market consensus, the US Dollar will lose interest and vice versa.
GBPUSD Technical Analysis
The four-hour chart’s Relative Strength Index (RSI) indicator soared over 50 early Tuesday, and the pair closed the previous four four-hour candles above the 20- and 50-period Simple Moving Averages (SMA), confirming the bullish tilt.
On the upside, 1.2200 (200-period SMA) serves as crucial resistance before the 1.2220/30 region, which contains the 100-period SMA and the Fibonacci 38.2% retracement level of the most recent rise.

A four-hour closing above the latter might pave the way for a longer-term comeback towards 1.2260. (static level).
On the downside, 1.2150 (Fibonacci 50% retracement) serves as the initial support level before 1.2100 (20-period SMA, 50-period SMA, psychological threshold) and 1.2070 (Fibonacci 61.8% retracement).


