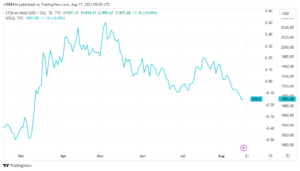
The gold price is licking its wounds following the breakdown of the 200 DMA.
The gold price is consolidating losses in early Thursday trade, having hit a five-month low of $1,890. As the United States Dollar (USD) continues to attract demand. Ahead of a new batch of mid-tier US economic data. Gold sellers are biding their time until the next plunge below.
The US dollar continues to rise, while gold prices fall.
The gold market is regaining some ground following a three-day slide, fueled by a generally stronger. US dollar and more flight to safety Recent. US economic figures highlight the safety and economic stability of the country.
The US dollar strengthened more on Wednesday. As benchmark 10-year US Treasury note rates rose to record 10-month highs slightly above 4.30%. In response to the hawkish US Federal Reserve Minutes from the July meeting. The Fed Minutes indicated that “most” officials continued to commit to keep inflation under control. Despite recognizing “upside risks” to inflation, perhaps implying additional rate rises from the Fed.
Furthermore, persistent Chinese economic fears, along with a resurgence of hawkish Fed views, drove risk assets plummeting, pumping safe-haven flows into the US Dollar. bullish US housing statistics contributed to the bullish sentiment around the US Dollar, aggravating the pain in the non-interest-bearing Gold price. Construction of single-family homes in Building Permits increased 0.1% to a yearly rate of 1.44 million units in the United States, up 6.7%.
Later in the day, the US weekly Jobless Claims and Philadelphia Fed Manufacturing Survey will be closely watched for confirmation of a healthy US economy, which might spark a new run higher in the US Dollar. Even if risk sentiment continues to deteriorate, the US dollar is likely to stay in a win-win scenario.
Technical analysis
On Wednesday, gold price extended its negative breach of the crucial 200-Daily Moving Average (DMA), currently at $1,906, backed by a Bear Cross confirmation on the daily chart.
On a daily closing basis, the downward-sloping 21 DMA cut the 50 DMA from above, verifying the bearish continuation pattern. The 14-day Relative Strength Index (RSI) is barely above oversold territory, indicating that gold sellers have more room to stretch their muscles.

Despite the recent rise, the downward bias for gold price remains strong amid bearish technical signs. The five-month low of $1,890 is considered as immediate support, followed by the March 15 low of $1,886. Deeper drops will put pressure on the $1,870 static support level.
Gold, on the other hand, has to reclaim the 200 DMA support-turned-resistance level in order to begin a decent rally toward the $1,920 round number. The $1,930 supply zone is expected to be the next relevant resistance level.


