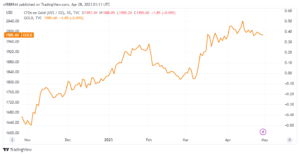
The gold price is still under pressure following a tumultuous day that concluded with small XAUUSD declines.
The gold price (XAUUSD) falls to $1,986 in the early hours of Friday’s Asian session, following a late Thursday corrective recovery off the weekly low. As a result, the precious metal maintains the previous day’s downward bias, which was mostly driven by US GDP, inflation. And employment numbers. However, the bullish performance of stocks, backed by the tech giant’s profits, joins the XAUUSD traders’ nervousness ahead of the Fed’s favored inflation indicator. The gold price validates positive inflation signals from US data. Ahead of the Federal Open Market Committee (FOMC) monetary policy meeting next week.
XAUUSD falls as US GDP figures show an increase in inflation, which favors US Dollar bulls.
The first readings of the US Gross Domestic Product (GDP) for the first quarter (Q1) of 2023, also known as Advance readings, were released on Thursday. And were mixed outcomes. Nonetheless, the headline US GDP Annualized fell to 1.1% from 2.0% projected and 2.6% previous. While the GDP Price Index increased to 4.0% from 3.9% prior and 3.8% market expectation. Furthermore, Personal Consumption Expenditure (PCE) Prices for Q1 increased to 4.2% from 3.7% in previous readouts. While Core PCE numbers for the same period exceeded 4.8% market predictions and 4.4% earlier with 4.9% level. It should be highlighted that a drop in weekly Initial Jobless Claims helped the US Dollar to maintain its strength.
Following the release of the data. The US Dollar Index (DXY) managed to register a significant rise of roughly 30 pips before trimming. Some of its gains but maintaining a daily positive finish. The same led the gold price to a weekly low at $1,984 before reducing losses. And retreating from $1,990 recently.
It should be emphasized, however, that the risk-on atmosphere. Fueled mostly by excellent profits from US technology companies and mixed US statistics. Allowed Wall Street to post its greatest daily gain in a week. The same thing drove US Treasury bond rates and put a floor under the price of gold. However, concerns over US banking repercussions have resurfaced. Following news that First Republic Bank (FRB) planned to liquidate half of its loan book. In order to bridge a $100 billion deposit flight deficit, weighing on the XAUUSD alongside hawkish Federal Reserve bets.
Following strong Core PCE Price readings, the Federal Reserve’s preferred inflation index is being watched.
Another factor weighing on the gold price is the likelihood of a stalemate in US debt ceiling discussions because most policymakers hold opposing viewpoints. House Speaker Kevin McCarthy recently stated, “I won’t pass a clean debt-limit increase. “Moving forward, the gold price is anticipated to be under pressure owing to recent hawkish Federal Reserve (Fed) worries. The market’s geopolitical concerns, and banking FRB-led banking troubles.
The quote’s continued decline, however, is dependent on the Fed’s favored inflation statistics. Notably the US Core Personal Consumption Expenditure (PCE) Price Index for March. Which is predicted to fall to 4.5% YoY from 4.6% before. If inflation signals are lower than expected, the gold market may cut recent losses while justifying the risk-on mentality. However, solid data prints may allow the Fed to postpone a policy turn. This, in turn, may precipitate a much-needed drop in the price of gold.
Overall, the gold price is losing positive momentum as markets prepare for the Federal Reserve’s preferred inflation indicator, as well as the Federal Open Market Committee (FOMC) monetary policy meeting next week.
Gold Technical Analysis
After continuous trading below the 21-day Simple Moving Average (SMA), gold seems poised to defy a six-week-old bullish channel structure.
Bearish signs from the Moving Average Convergence and Divergence (MACD) indicator, as well as a decreasing but not below 50 Relative Strength Index (RSI) line, both at 14, contribute to the negative bias.

However, a persistent breach of the $1,980 support, which serves as the bottom line of the indicated channel, is required for the gold price to entice bearish. Nonetheless, February’s high at $1,960 and the 50-day SMA near $1,930 should limit more bearish swings.
It’s worth noting that an upward-sloping support line from early November 2022, close to $1,890 at the time of writing, seems to be the last line of defense for XAUUSD purchasers. A breach of which might overturn the bullish trend that has been in place for the past six months.
To persuade bulls, gold price recovery must deliver a daily close over the 21-day hurdle of $1,997, as well as successful trading above the $2,000 level.
However, several swings around $2,010 can test XAUUSD purchasers before preparing them for a rocky journey to the north, which includes early levels of $2,030 and $2,050 before the expected reversal point around $2,060, which comprises the previously indicated channel’s top line.


