Gold may test multi-month highs. If the bull technical signal stays intact. Risk market mood and the likelihood of rising US interest rates are two recent major influences on gold.
Gold remains in a tight range. Looks at interest rates
Gold’s recent strong drivers, risk investor sentiment, and US interest rate odds haven’t altered much so far today. Keeping the gold trapped in a narrow trading band. Markets continue to attempt to ease their concerns about a new banking catastrophe. And there is a slim chance that the US will raise interest rates another 25 basis points.
In addition, there will be a shorter trading week. And this will make the financial markets more susceptible to possible spikes in volatility as we get closer to the Easter weekend. The most recent US Jobs Report (NFP), a well-known market guide, was published on Friday, which raises the risk.
Fundamentally in gold
A technical structure on the daily graph indicates that an upward move higher may be possible in the near term. Although the fundamental environment for gold is presently neutral. After a significant uptrend and a time of fusion, a bullish pennant formation develops. At some point, a string of lower peak levels and elevated lows will come together. And if the structure holds, the upward tendency will continue.

Gold still has to hit $2000.
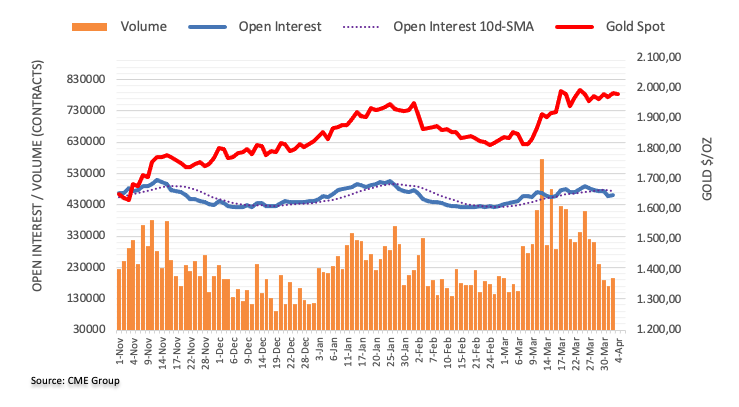
The value of an ounce of troy gold rose at the beginning of the week and challenged the $1990 mark again. The increase was driven by increasing open interest as well as the amount Which suggests that the precious commodity will continue to gain momentum shortly. 2023 high at $2009 stays a potential target on the upswing in the meantime.
Technical Viewpoint
Currently, gold is trading at around $1,983 per ounce. And is close to both the $2k level and the March 2023 peak at $2,009.75 per ounce. If the valuable metal rose above this point, it would reach previous highs from more than a year earlier. Previous peaks at $2,070/oz and $2,075/oz would be susceptible. If there were a verified break above this mark.
Technical Summary (Daily)
| Name | Type | 5 Minutes | 15 Minutes | Hourly | Daily |
|---|---|---|---|---|---|
| Copper
4.0282 |
Moving Averages: | Strong Sell | Strong Sell | Strong Sell | Sell |
| Indicators: | Strong Sell | Strong Sell | Strong Sell | Buy | |
| Summary: | Strong Sell | Strong Sell | Strong Sell | Neutral | |
| Gold
2,000.55 |
Moving Averages: | Neutral | Buy | Strong Buy | Strong Buy |
| Indicators: | Buy | Strong Buy | Strong Buy | Strong Buy | |
| Summary: | Neutral | Strong Buy | Strong Buy | Strong Buy |


