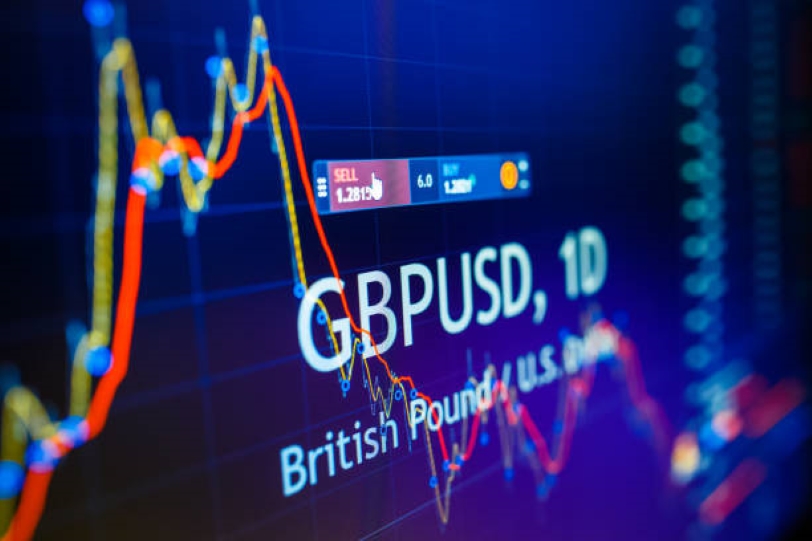
GBPUSD regains some of its lost ground, closing in on 1.2170.
The GBPUSD 50- and 100-hour EMAs are held below , while the RSI indicator is in bearish zone.
1.2200 is the critical resistance level, and 1.2143 is the first level of support.
The GBPUSD exchange rate maintains below 1.2200 on Wednesday during the Asian session, halting its downward trend. The pair receives some support from the US dollar’s decrease and the US Treasury bond rates’ decline.
The USD’s decline might be limited for the time being, though, by the resurgence of safe-haven flows in the midst of the Middle East’s geopolitical tensions and the US’s higher-for-longer rate story. As of press time, the pair has gained 0.08% on the day and is trading at 1.2170.
GBPUSD Technical Outlook
Technically speaking, the four-hour chart of GBPUSD holds below the 50- and 100-hour Exponential Moving Averages (EMAs), indicating that more downside is likely. Furthermore, the sellers are supported for the time being by the Relative Strength Index (RSI), which remains below 50 in negative territory.
Nevertheless, the critical resistance level, which represents the intersection of the psychological round figure and the 50-hour EMA, is situated at 1.2200. Any significant follow-through purchases above the latter will open the door to a peak of 1.2218 on October 16.
The next stop will be 1.2271, the upper boundary of the Bollinger Band, which is located further north. One more upside filter to keep an eye on is close to a peak of 1.2295 on October 10.
A low of October 23 at 1.2143 serves as the first level of support on the downside. The subsequent downward pause is observed at the low of 1.2122 pound on October 13. It will appear that the essential contention level is in the 1.2095–1.2100 area.
The level in question is a round number, the Bollinger Band’s lower bound, and a low point of October 20. Should the barrier be broken, the price will fall to 1.2052 (the low from October 3).


