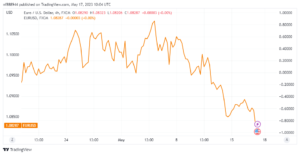
EURUSD lost traction and fell to its lowest level.
Early Wednesday, the EURUSD lost traction and fell to its lowest level in almost a month, below 1.0850. Although the pair’s technical outlook indicates oversold circumstances, sellers may want to maintain control unless risk sentiment improves considerably.
The US dollar continues to profit from the market’s cautious mindset.
Despite investor optimism that the US would avoid a default following the latest round of debt ceiling discussions on Tuesday. Markets remain risk-averse mid-week. The Euro Stocks 50 Index is down roughly 0.3% in early European morning trading. While Dow Futures are down 0.75%.
Following his meeting with US President Joe Biden and other senior legislative leaders on Tuesday. Leading congressional Republican Kevin McCarthy told reporters that a compromise on extending the debt ceiling by the end of the year was conceivable.
Furthermore Building Permits and Housing Starts data for April will be released in the second half of the day on the US economic calendar. Richmond Federal Reserve Bank President Thomas Barkin expressed concern about. The commercial office sector to Bloomberg on Tuesday. If Building Permits, which are expected to climb 3% after falling 7.7% in March, fall more in April, the US Dollar may struggle to gain strength in the second part of the day.
Nonetheless, EURUSD investors will continue to pay close attention to risk perception and central bank officials’ statements. If Wall Street’s main indexes fall after the opening bell, the USD should be able to hold its own versus its competitors, putting pressure on the pair.
EURUSD Technical Analysis
On the four-hour chart, the Relative Strength Index fell below 30, indicating that the EURUSD is oversold in the near term.
If the pair has a technical correction, 1.0850 (static level, 20-period Simple Moving Average (SMA)) will act as intermediate resistance before 1.0900 (psychological level, static level).

Moreover a four-hour close above the latter might deter selling. And pave the way for a longer-term rally towards 1.0930 (50-period SMA).
On the downside, the next negative objective is 1.0800. (Fibonacci 50% retracement of the most recent uptrend). Followed by 1.0740 (Fibonacci 61.8% retracement).


