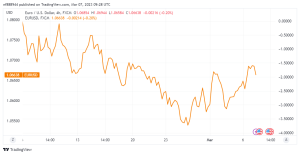
EURUSD is trading close to 1.0700.
After posting substantial daily gains on Monday, the EURUSD has entered a stabilization period slightly around 1.0700 on Tuesday. The pair is holding above a crucial resistance level. And the near-term technical view indicates that more gains are expected. The US Dollar’s reaction to FOMC Chairman Jerome Powell’s comments on the policy outlook later in the day.
FOMC Chairman Jerome Powell will speak on monetary policy.
The rising risk sentiment made it harder for the US Dollar (USD) to find demand on Monday. EURUSD reached a new two-week high. Yet, Wall Street’s main indexes lost ground after a strong start to the day and concluded flat. Allowing the USD to contain its losses for the time being.
As investors wait, they are unlikely to gamble on additional Dollar decline. The Federal Reserve did not discuss disinflation in its Semi-Annual Monetary Policy Report released on Friday. Instead stating that further policy rate hikes will be necessary to return to 2% inflation.
Powell will almost certainly be questioned whether the January statistics. Which showed an increase in inflation and robust growth in nonfarm payrolls, will need more tightening measures. Markets are currently pricing in a 28% chance of a 50-basis point (bps) rate rise at the next meeting. If Powell implies that they may resume larger rate rises. USD is expected to regain its strength, forcing the EURUSD to reverse its trend.
Powell, on the other hand, might restate that a rate hike of 50 basis points is out of the question. During the conference. According to market expectations, such a remark might induce a drop in US Treasury bond rates and lead the USD to lose value. Powell may alternatively strike a neutral tone, reminding investors that the Fed will continue to rely on data assessing. The February employment report and the Consumer Price Index (CPI) before determining what to do next. It may make finding direction ahead of Friday’s employment data harder.
EURUSD Technical Analysis
The four-hour chart’s Relative Strength Index (RSI) indicator is comfortably above 50, indicating a bullish tilt. Furthermore, on the four-hour chart, the past four four-hour candles closed above the 100-period Simple Moving Average.
Temporary resistance appears to have established for the pair at 1.0700. (psychological level, static level), ahead of 1.0720. (Fibonacci 38.2% retracement of the most recent downturn).

A four-hour close above the latter may pave the way for further advances towards 1.0740. (200-period SMA) and 1.0780 (Fibonacci 50% retracement).
On the downside, 1.0670 (previous resistance, static level) serves as first support before 1.0650. (Fibonacci 23.6% retracement, 100-period SMA).And 1.0620 (Fibonacci 23.6% retracement, 100-period SMA) (50-period SMA, ascending trend line coming from February 26).


