Crude oil and Natural Gas Highlights
Crude oil prices are rising due to increased demand in the United States and China. In addition to suggestions from the US central bank about rate cuts.
The Natural gas is steady around $1.85 mark, amid barriers at $1.92 & $2.06 area, as shown by positive EMA signs.
The Brent oil’s careful increase to $83.38 will be tested at $83.47 obstruction, although it remains strong over the pivot $82.97 zone.
Crude Oil Fundamentals
Increased demand and the Federal US Fed’s cautious attitude caused oil prices to rise.
The cost of oil has risen, boosted by substantial demand in important countries such as the United States and China. As well as optimistic indications by the Fed about prospective rate reduction. Crude oil stockpiles in the United States are rapidly falling, showing high demand. That may increase as the summer travel season arrives.
At this point, both India and China are increasing their oil intake, which is connected to robust manufacturing activity. Nevertheless, the current year’s demand rise in China could below 2023’s spike. The Fed’s softer attitude on rates, along with a lower American dollar, additionally contributed to crude oil’s rise.
US WTI Technical Outlook
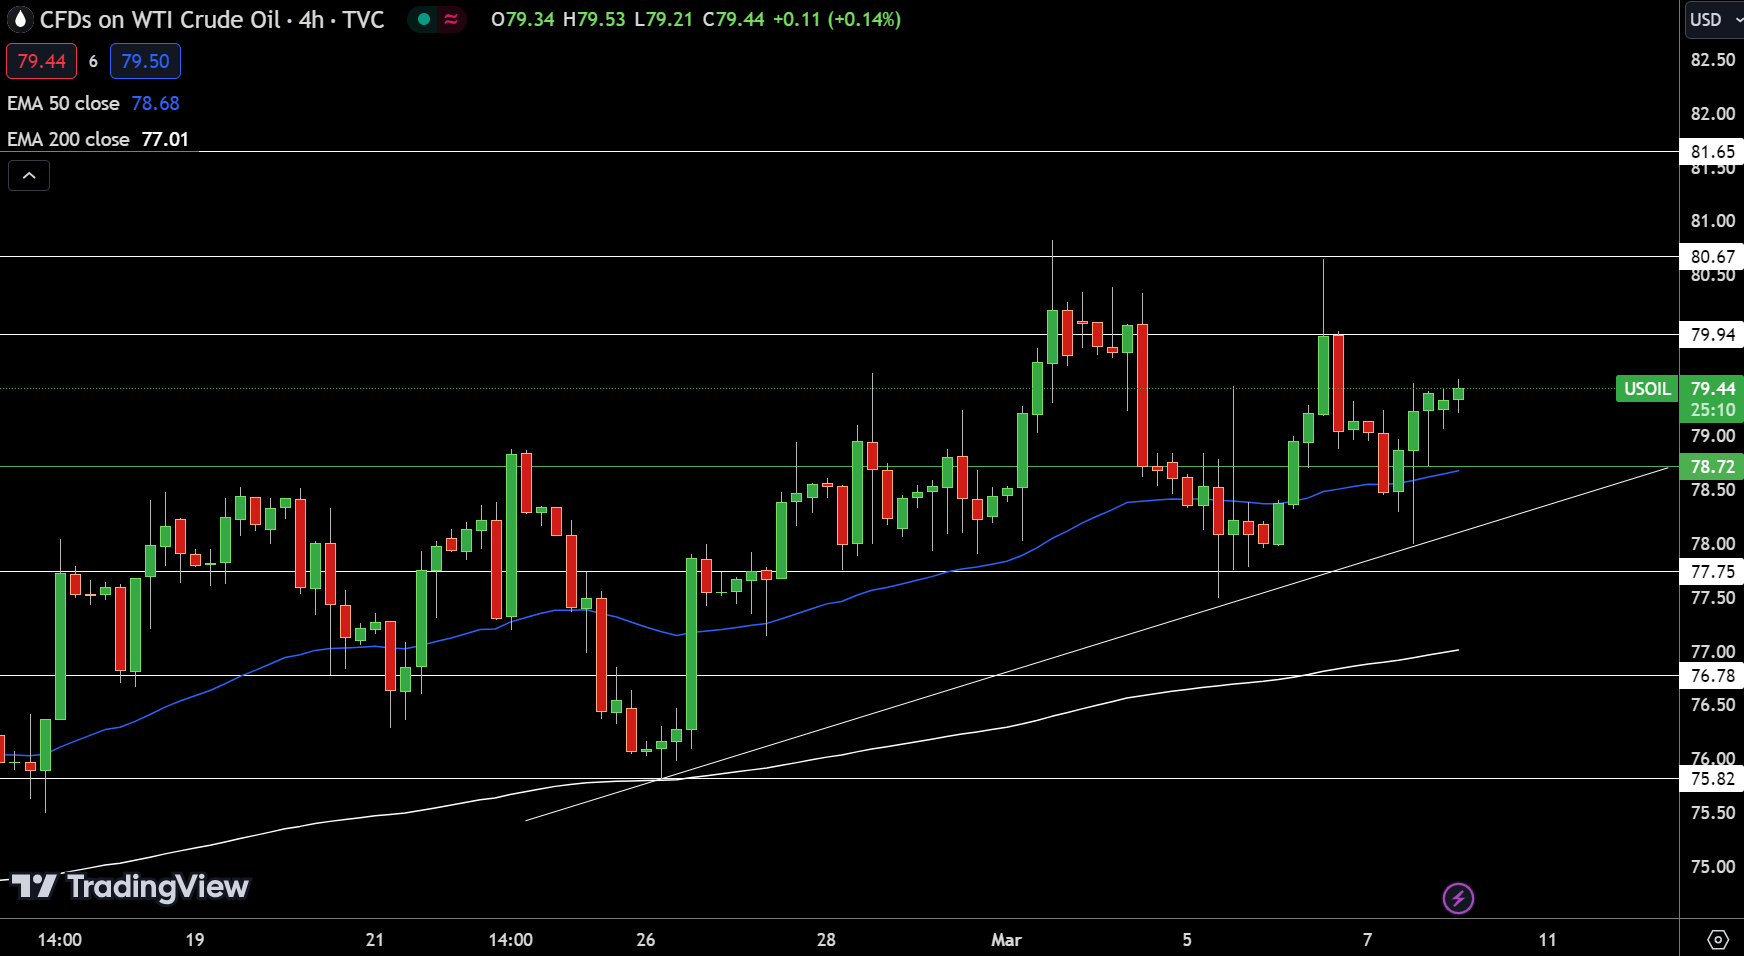
Friday March 8th, WTI Crude rose marginally to $79.44 mark, up 0.10 percent during a turbulent trading market. The pivot mark of $78.72 represents a significant intersection, as the price of oil just above this level. Investors are looking for early barriers at $79.94, then $80.67 level. And ultimately around $81.65, wherein pressure to sell could grow. On the way down, supports develops at $77.75 mark, with further safeguards around $76.78 & $75.82 levels. Wherein investors may resurface.
Several technical indicators provide insight into the marketplace’s blend. -The 50 D-EMA around $78.68 & the 200 D- EMA on $77.01 each imply fundamental purchasing demand. Maintaining the immediate tendency conservatively positive. In brief, WTI path stays optimistic for so long as it stays over the $78.70 threshold.

Source: TradingView- WTI daily chart
WTI Technical Indicators & Signals
| Name | Value | Action |
| RSI(14) | 59.477 | Buy |
| STOCH(9,6) | 64.705 | Buy |
| STOCHRSI(14) | 80.837 | Overbought |
| MACD(12,26) | 1.060 | Buy* Caution |
| ADX(14) | 20.974 | Buy |
| Williams %R | -18.762 | Overbought* Caution |
| Name | Value | Action |
| CCI(14) | 136.6391 | Buy |
| ATR(14) | 1.9257 | Less Volatility |
| Highs/Lows(14) | 0.4807 | Buy |
| Ultimate Oscillator | 48.657 | Sell |
| ROC | 2.304 | Buy |
| Bull/Bear Power(13) | 1.9920 | Buy |
Brent Oil Technical Outlook
Brent crude oil prices rose 0.26 percent to $83.38 level on Friday. Showing moderate confidence in the energy sector. According to the technical assessment for the given day, the point of pivot is $82.97, that will impact right away trend. Levels of resistance have been discovered progressively at $83.47 level & $84.06 mark. Adding a further significant hurdle at $84.86 which could test the bull trajectory.
Assistance, on the other hand, remains sturdy around $82.56, with subsequent supports at $82.03 & $81.43area. Serving as possible alternatives for decreased prices.
The 50 & 200 D-EMAs, around $82.68 & $81.62, each, indicate a market trending upward. The view holds positive for as long as prices continues over the turning point at $82.97 mark. But a drop beneath might spark an additional severe selling move.
Natural Gas Technical Outlook
The Natural gas fell slightly to $1.85, at 0.11 percent drop. The present-day trade puts the turning point exactly at $1.85 mark. Showing that the markets are in balance yet with room for volatility.
The levels of resistance are set at $1.92, $1.98, then $2.06 area. All representing a challenge of the assets rising trend. At the same time, deeper levels of support have been formed around $1.79, $1.73, & $1.68 zone, wherein falls could hit an area of support.
The 50 & 200 D- EMAs are at $1.91 & $1.99, accordingly, showing a little bull bias over the present value. A persistent position over $1.85 mark could maintain the positive story. Nonetheless, a drop under might result in additional selling action.
Natural Gas (NG) daily Technical Indicators & Signals
| Name | Value | Action |
| RSI(14) | 44.836 | Sell |
| STOCH(9,6) | 73.193 | Buy |
| STOCHRSI(14) | 66.278 | Buy |
| MACD(12,26) | -0.104 | Sell |
| ADX(14) | 30.619 | Buy |
| Williams %R | -42.369 | Buy |
| Name | Value | Action |
| CCI(14) | 5.5534 | Neutral |
| ATR(14) | 0.1546 | High Volatility |
| Highs/Lows(14) | 0.0000 | Neutral |
| Ultimate Oscillator | 41.559 | Sell |
| ROC | 15.404 | Buy |
| Bull/Bear Power(13) | -0.0540 | Sell |


