Crude Oil and NG Highlights
This Thursday, WTI fell for another day in a row, trading at $81.87.
A surge in American oil stockpiles plus the potential of an extension in US Fed rate reduction are dragging the crude oil down.
Crude dealers are keeping an eye on events in the Middle Eastern region’s diplomatic situation.
The NG raises to $1.9520 mark, up 1.72 percent, reflecting positive movements over the $1.91 fulcrum.
The Brent crude oil remains steady at $87.58 / barrel as tensions in the Middle Eastern region ease.
Fundamental Picture
American oil stockpiles grew for an additional consecutive week. Oil in crude form stocks in the US increased by 2.735 mil bbls in the period ended the 12th of April. Following a gain of 5.841 mil bbls the week before. As reported by the EIA on Wed, the market’s average predicted a rise in stockpiles of 1.6 mil bbls.
The market Snapshot
The price of oil are back to normal after a 3 percent drop, with Brent near $87.59 / barrel with WTI crude on $81.87 mark. amid concerns over a larger Arab-Israeli war fade. Market sentiment is reacting to weaker-than-projected demand for fuel with rising the US oil stocks. Signifying a possible slowdown in economic growth, especially in Beijing.
Furthermore, such events have a second-order effect on natural gas estimates. Due to the interrelated structure of energy exchanges. The diminished chance of a catastrophic conflict involving Iran and Israel allays fears over supply interruptions to a crucial oil-producer’s zone.
The likelihood of aggravation in the region’s Middle East looks to be low for the moment. Nevertheless, crude dealers will remain a watch on Israeli and its reaction. Particularly since Joe Biden, the US president, advocated moderation.
WTI Crude Analysis
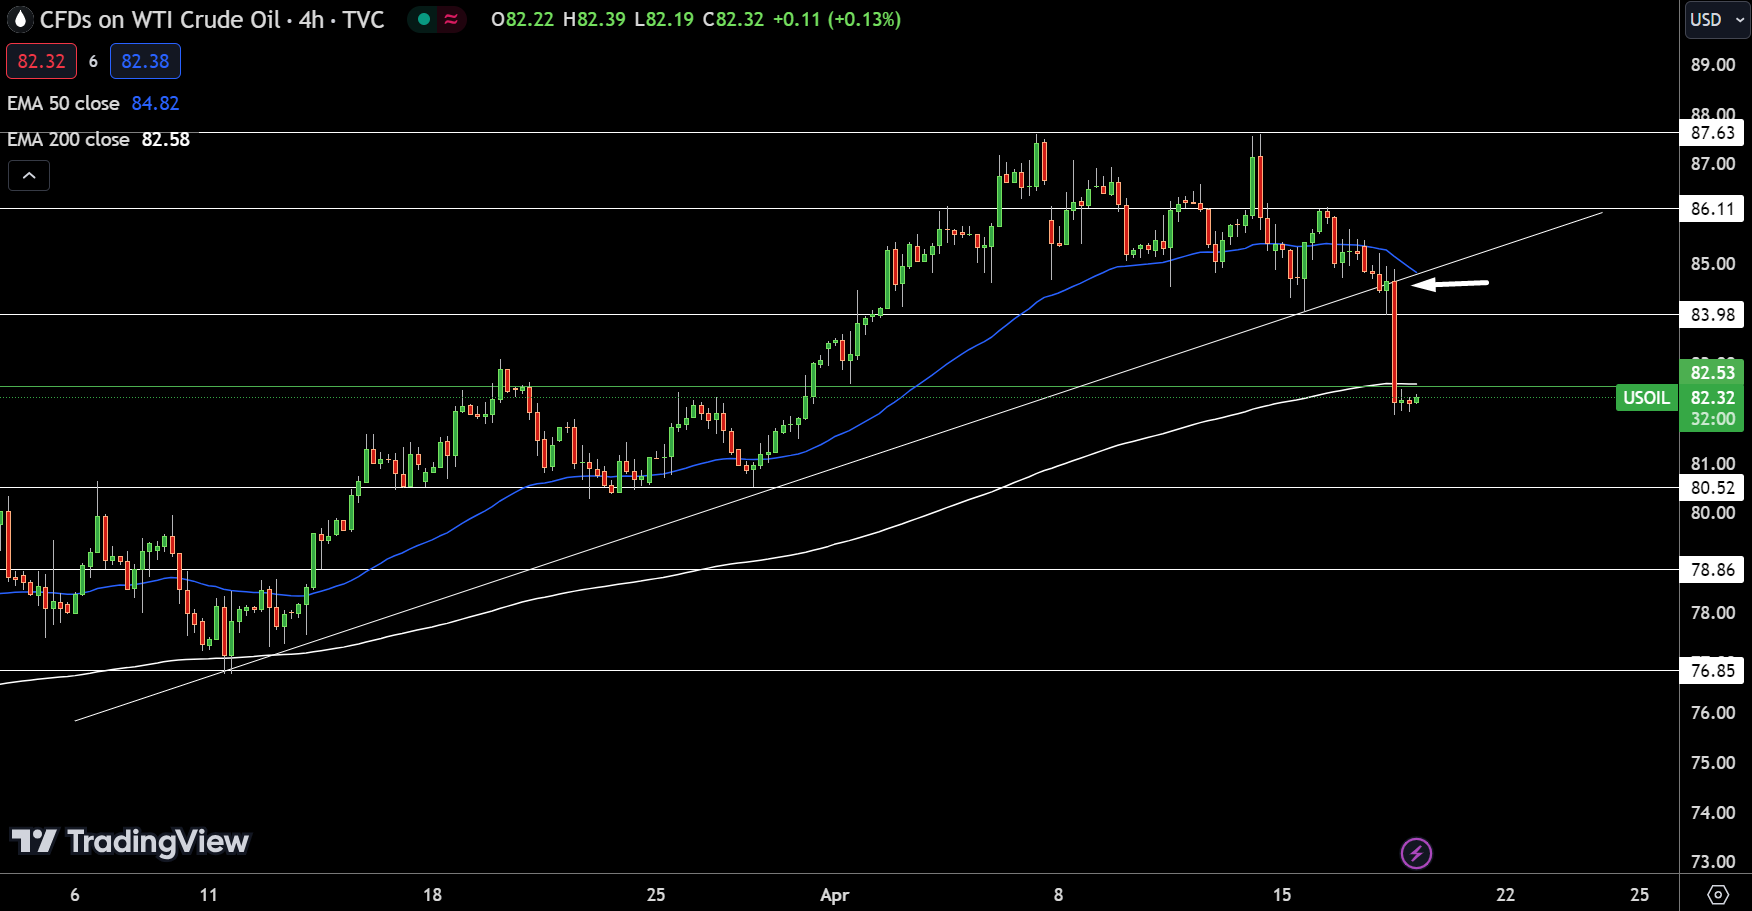
WTI crude rises slightly right now, sitting around $81.583, upward 0.04 percent. The market as a whole may be on an impasse, as it breached the pivoting point of $82.53. The levels of resistance are marked on $83.98, $86.11, then $87.63 mark. With supporting around $80.52, $78.86, then $76.86 level.

Source: TradingView
The value of the RSI indicates flat motion. The 50 D- EMA sits at $84.83, while the 200 D- EMA is near $82.58Mark. showing a minor negative trend. Should values go beneath $82.52, a major selling might occur.
Brent Crude Analysis
Brent oil rose slightly Wednesday, reaching $87.59 mark before dropping. The asset in question is now trading slightly over its pivotal point at $86.38 Moving forward, levels of resistance include $88.68, $90.09, then $91.82 mark. On the negative side, security is identified near $85.78 mark, and additional support located at $84.63 & $82.95 zone.
The technical charts show a positive attitude over the pivot point, as seen by the 50 D- EMA around $89.42, Which suggests possible obstruction, while the 200 D- EMA on $86.98, which signals solid foundation stability. A decline beneath $87.12 might spark a significant selling (Present), reversing the market’s momentum.
Natural Gas (NG) Analysis
rates are currently at $1.9521, up 1.72 percent. The NG continues to trade over its pivotal point of $1.910 mark. showing a positive immediate outlook. The levels of resistance have been set at $1.99, $2.04, as well as $2.07 mark.
If a downward trend develops, safety may be located around $1.85 area. subsequently followed by $1.78 then $1.73 mark. The technical situation is strengthened with the 50 D-EMA near $1.91 & the 200 D- EMA on $1.90 mark. All of which are supporting the present pricing.
A drop beneath $1.90 mark might spark a big selling, signifying an important monitoring area for investors.
Crude oil Daily Technical Indicators & signals
WTI Crude
| RSI(14) | 27.945 | Sell |
| STOCH(9,6) | 33.223 | Sell |
| STOCHRSI(14) | 0.000 | Oversold*Caution |
| MACD(12,26) | -0.800 | Sell |
| ADX(14) | 44.616 | Sell |
| Williams %R | -98.395 | Oversold |
| Name | Value | Action |
| CCI(14) | -178.4078 | Sell |
| ATR(14) | 0.8543 | Less Volatility |
| Highs/Lows(14) | -2.2479 | Sell |
| Ultimate Oscillator | 31.889 | Sell*Caution (Oversold) |
| ROC | -3.512 | Sell |
| Bull/Bear Power(13) | -3.2020 | Sell |
Natural Gas
| Name | Value | Action |
| RSI(14) | 53.946 | Neutral |
| STOCH(9,6) | 46.162 | Neutral |
| STOCHRSI(14) | 100.000 | Overbought*Caution |
| MACD(12,26) | -0.014 | Sell |
| ADX(14) | 40.887 | Buy |
| Williams %R | -25.658 | Buy |
| Name | Value | Action |
| CCI(14) | 189.4148 | Buy |
| ATR(14) | 0.0451 | High Volatility |
| Highs/Lows(14) | 0.0340 | Buy |
| Ultimate Oscillator | 58.798 | Buy*Caution |
| ROC | 2.921 | Buy |
| Bull/Bear Power(13) | 0.0560 | Buy |


