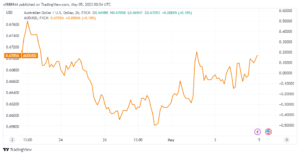
The AUDUSD is battling for acceptability over 0.6700.
In the Asian session, the AUDUSD pair is constantly encountering roadblocks at the round-level resistance of 0.6700. The Australian currency remained active on Thursday following positive Australian Trade Balance statistics.
The Australian Dollar’s outlook has strengthened as a result of the strong Australian Trade Balance statistics.
According to the Australian Trade Balance statistics, exports of Australian products to China reached A$19 billion ($12.71 billion) in March, up 31% year on year and surpassing the previous record from mid-2021, as reported by Reuters. In addition, the Trade Balance report revealed that the Asian giant bought a large amount of iron from the Australian steel sector and reduced obstacles to thermal coal imports as diplomatic ties improved. This has quickly brightened the outlook for the Australian Dollar.
Meanwhile, the US Dollar Index (DXY) has corrected to near 101.36 due to concerns about US banking and debt. Ceiling difficulties are frequently weighed. Investors are also wary ahead of the US Nonfarm Payrolls (NFP) report.
AUDUSD Technical Outlook
On a two-hour basis, the AUDUSD is about to break out of the Inverted Head and Shoulder (H&S) chart pattern. A breakout of an inverted H&S pattern usually suggests a positive turnaround after a period of protracted consolidation.
The 10-period Exponential Moving Average (EMA) around 0.6688 is giving the Aussie bulls some breathing room.
Meanwhile, the Relative Strength Index (RSI) (14) is attempting to enter the bullish range of 60.00-80.00. The recurrence of the same will trigger the upward momentum.

A confident move above in the future My February high of 0.6717 will propel the Aussie asset to its April 20 high of 0.6771. The round-level resistance at 0.6800 comes next.
In an alternate scenario, US Dollar bulls will flex their biceps if the Australian currency falls below its March 15 low of 0.6590. If this occurs, the asset will be exposed to the March 08 low of 0.6568, followed by the 02 November 2022 high of about 0.6500.
Daily Trends
| Daily SMA20 | 0.6677 |
| Daily SMA50 | 0.6683 |
| Daily SMA100 | 0.6788 |
| Daily SMA200 | 0.673 |


