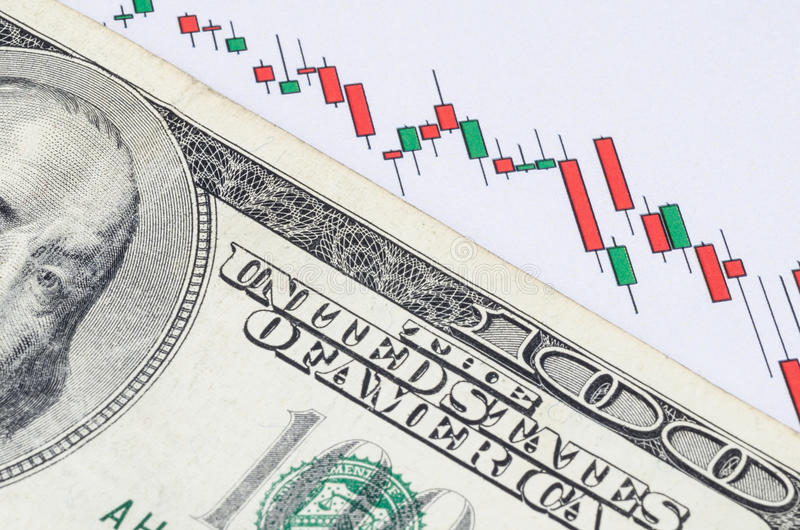
US dollar index at the mercy of US Inflation data next week. DXY expects that the week will end with a three-day losing streak due to wild swings in price action.
US dollar Sentiment
With contrasting market responses to Fed Chair Powell’s testimony and Friday’s NFP data, the US dollar experienced some volatility price action this week.
The Fed Chair Powell’s 2 hearing on the Fed’s monetary policy started on Tuesday-that day in specific. The dollar rose and expectations for a higher peak price from the Fed in 2023.
The probability of a 50 bps increase reached a high of 76 percent ahead of Friday’s jobs report. Likewise, markets adjusted their estimates for the Fed’s coming March meeting.
US dollar forecast is based on Powell’s statements on data importance
Since no decision had been taken regarding the Fed’s March meeting, Powell was eager to emphasize the significance of the data going forward.
With a figure of 311k, Friday’s NFP report exceeded expectations; however, jobless edged up and average hourly earnings fell, with the latter 2 data lines appearing to be more significant.
The market’s response is evidence of this, as we saw the DXY fall sharply, while any gains made by dollar-denominated pairs rose. Some even to points greater than those seen before Powell’s statement.
The likelihood of a 50bps increase by the Fed in March decreased as well, with market players now backing another 25bps increase. The largest daily decline for the Dollar Index (DXY) since Feb 1 appears to be imminent.
Looking ahead to the US dollar
The DXY may be impacted by a number of high-impact US data events in the coming week because at the present. Data releases are driving moves much more than technical factors are. This makes a long-term technical picture challenging as everyone’s attention is focused on the US inflation figures due out next week.
Was the slight decline in average hourly earnings this week the first indication of a possible decline in next week’s inflation hard copy?
Technical Perspective
Technically speaking, the dollar index weekly graph(DXY) is headed for a second straight week of declines. The weekly candle is also keeping a watch out for a shooting star or doji candle close. Suggesting additional declines in the coming week.

Candle Time Mar 10, 2023, 1 Candle Ago
Indication: Bearish reversal
High Durability
The market gains momentum on a long white candlestick during an upswing. The 2nd candlestick ends at or very close to its open and trades in a tight band.
This situation typically demonstrates a loss of faith in the current trend. The black third candlestick serves as validation of the pattern reversal. The bearish Doji Star pattern is completely developed in the Evening Doji Star indicator.
Absence of Follow Through on the Inverted Head and Shoulder Pattern Break.
The DXY broke the neckline on Tuesday and the 100-day MA was in action on the daily timeframe, forming an inverted head and shoulders pattern. Since then, we have witnessed a doji candle closure, a downward move on Thursday. Any further decline on Friday, which is expected to be the DXY’s biggest single-day decline since Feb 1.
The daily candle is presently edging closer to the 104.30 support line, and closure under that level would increase the likelihood of further declines in the coming week.
This could possibly push prices up to the top of the range we broke out of in Feb. Which is around the 102.90 level, and bring the 50-day MA back into play around the 103.50 zone.
The 100-day MA is located just above the 105.00 zone, and closure above that level could trigger a move higher toward this week’s top at 105.80. Any upward movement will have to avoid the 200-day MA, which is currently resting at the 106.60 mark.


