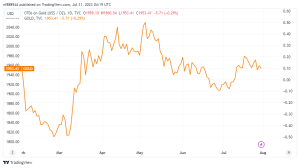
As July draws to a close, the price of gold is halting the upward trend. That began on Friday and consolidating monthly gains. In the wake of weaker inflation data. The US Dollar (USD) is projected to drop for a second consecutive week. This is due to dovish US Federal Reserve (Fed) predictions. All eyes are now focused on Friday’s announcement of US Nonfarm Payrolls for a potential new direction in the gold price. The top-tier economic figures from the Eurozone on Monday will be released in the interim. US PCE inflation supports the Fed’s dovish wagers as we await important Eurozone data.
After a gloomy end to the Fed week that ended the gold price’s comeback attempt. The US Dollar is trying to recover. The US dollar has been supported by the US Treasury bond yields’ recent increase. However, a risk rises on Asian indices brought on by rising hopes for Chinese policy stimulus might restrain the bulls of the greenback while providing support for the price of gold.
Official PMIs from China are mixed, raising optimism for policy stimulus and possibly supporting the price of gold.
The mixed results of China’s official Manufacturing and Non-Manufacturing PMIs for July. Confirmed predictions of additional stimulus measures to be implemented by the Chinese government to boost economic recovery. According to a projection, the official Manufacturing PMI stood at 49.3 from 49.0 in June. China’s Non-Manufacturing PMI fell from 53.2 in June to 51.5 in the reported reading. China responded by announcing initiatives to increase and restore consumption.
On Friday, weaker-than-expected US Personal Consumption Expenditures (PCE) Price Index data rekindled market rumors. That the Federal Reserve’s tightening cycle was about to come to an end. The PCE price index, excluding food and energy, rose just 0.2% from the previous month. According to the Commerce Department. The core PCE, the Fed’s favored inflation indicator, increased by 4.1% from a year earlier as opposed to the forecasted 4.2% increase. The annual rate fell from a pace of 4.6% in May to its lowest level since September 2021. The Employment Cost Index, another Fed-monitored indicator. Increased 1% during this time. the June quarter, below expectations.
Following easing price pressures in the US, the market’s expectations for Fed rate increases in September. And November have significantly decreased. Which hastened the Greenback’s second consecutive weekly loss.
Future preliminary inflation and Gross Domestic Product (GDP) readings for the Eurozone will be anxiously waited for new policy cues on the European Central Bank’s (ECB) rate outlook. Rising indicators of a recession in the Eurozone coupled with persistent inflation are likely to depress risk sentiment. Which might contribute to the strengthening of the safe-haven US Dollar at the expense of the price of gold.
Technical analysis
On the daily chart, it can be seen that the Gold price recovery slowed down below the bullish On Friday. The 100-Daily Moving Average (DMA) was $1,968.
The bull cross between the 21 and 50 DMAs is still active. And the 14-day Relative Strength Index remains bullish when above the midline.
The 21 and 50 DMAs confluence support near $1,947 is therefore expected to prevent any decline in the price of gold.

Failure to hold above the latter will put the $1,943 two week lows in danger. Below which another slide toward the $1,930 round number is not completely improbable.
The bullish 100 DMA at $1,968 will be tested higher. And immediate resistance is indicated at Friday’s high of $1,964. On the upside, positive technical indicators will continue to favor gold bulls.
Gold purchasers must establish themselves firmly above the latter in order to resuming the current upward trend in the direction of the multi month highs of $1,988. Prior to that, they will have a hard time breaking Thursday’s high of $1,982.


