The Federal Reserve’s careful rate posture and the growth in US crude inventories point to unclear oil market patterns. WTI steady to lower
Natural Gas and Oil Behavior: How Rate Reductions, stocks, and the OPEC+ Plan Affect Marketplace?The price of crude moved little in Asian trade on the third day. Owing to worries of an eventual postponement in the US rate of interest decrease. With a rise in US crude stocks. This slowing in the rise occurred without the possibility of prolonged production cutbacks from OPEC+. members.
The US Fed members have proposed a measured approach to rate cuts, emphasizing the desire to contain price inflation. That could’ve an influence on financial projections for rate cuts.
Furthermore, a major rise in US oil stocks was noted as well as advances towards an end to violence in Gaza. Should OPEC+ continues with its production curbs, the crude oil market might get more tighter.
Furthermore, Moscow declared a 6-month restriction on petrol shipments to fulfil its own needs and ease facility repair. Thereby altering the worldwide natural gas and crude oil market dynamics.
Key Highlights
- The Fed’s cautionary approach on interest rates, along with an increase in US oil stockpiles. It suggests unpredictable crude market trends.
- OPEC+ discussions over prolonging supply curbs might drastically constrain international oil supplies.
- the Russian prohibition on petrol exports highlights strategic implications on the gas as well as crude oil markets.

The US WTI crude Analysis
Source: TradingView & CAPTIAL.COM
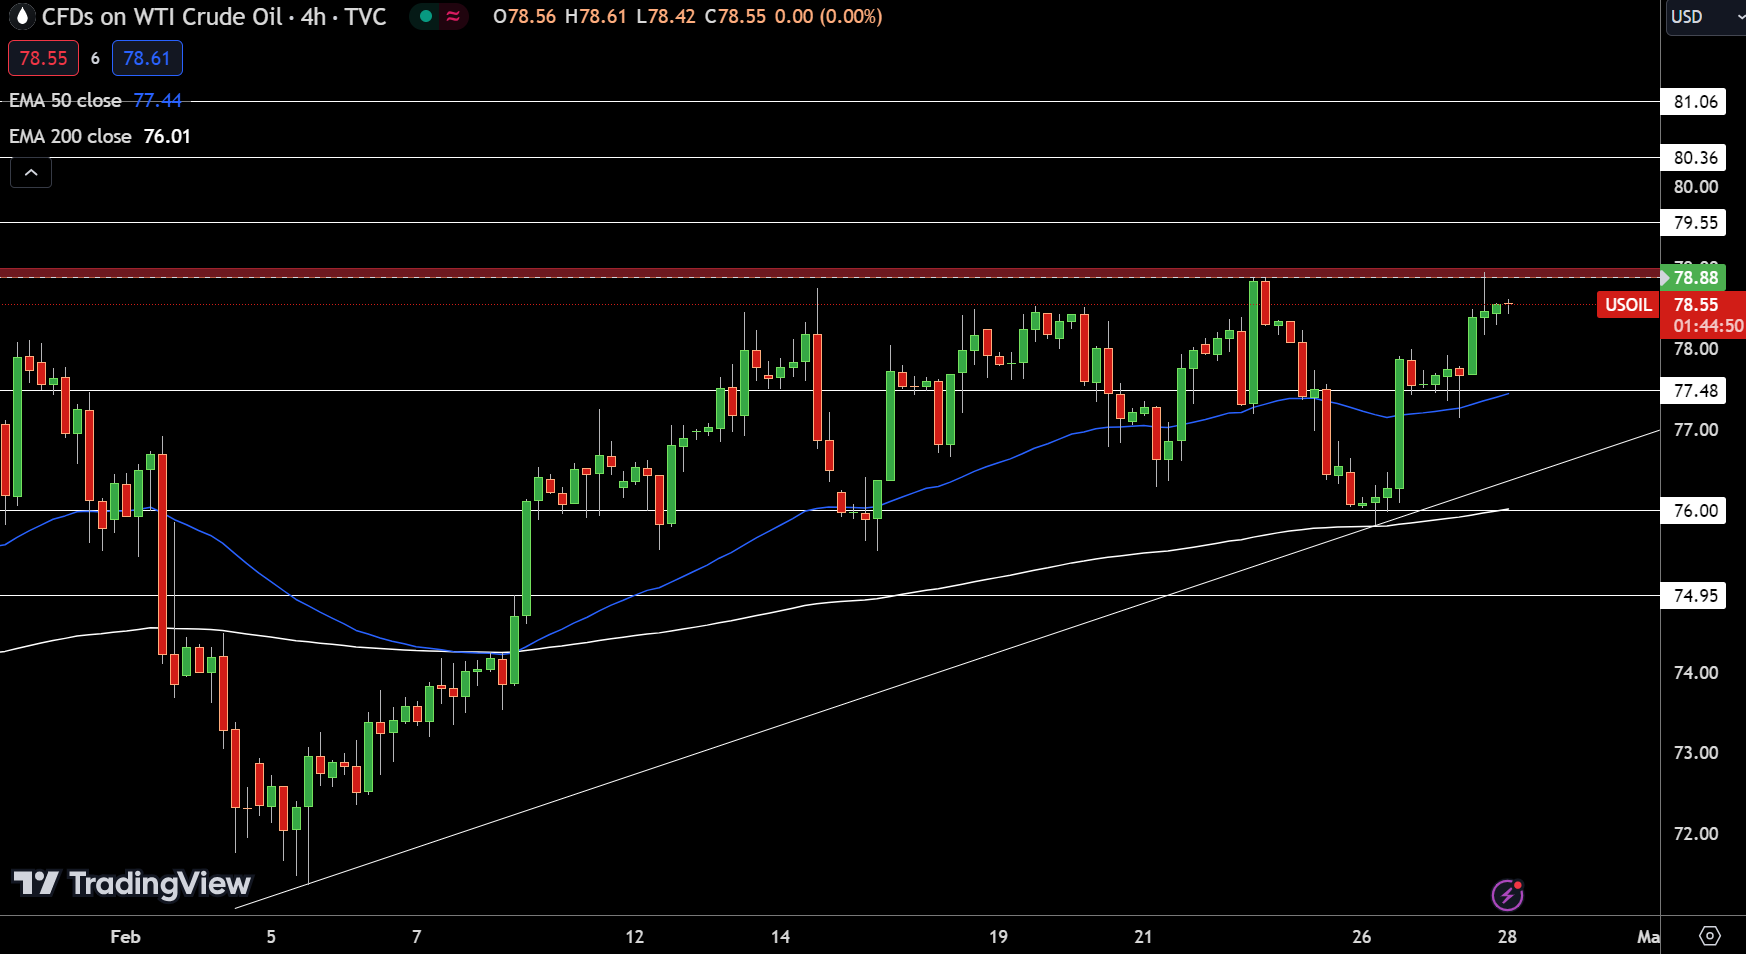
US WTI oIl rose slightly Wednesday, reaching $78.53 mark, gaining 0.09 percent during initial trading sessions. Examining the graph for four hours, the pivot mark for WTI is $78.88, showing a wary market mentality. The levels of resistance will likely be around $79.55, $80.36, then $81.06 point. Offering possible obstacles to higher progress.
In contrast, the areas of support are clearly indicated at $77.48, $76.00, & $74.95, that could offer buy chances if values fall. The 50 and 2oo D- EMAs, which are at $77.44 & $76.01, each, highlight the marketplace’s present steadiness.
Nevertheless, a negative outlook under the $78.88 three times crest formation. That calls for attentive tracking, implying a calculated response to probable direction changes.
The Brent oil Analysis

Source: TradingView & CAPTIAL.COM
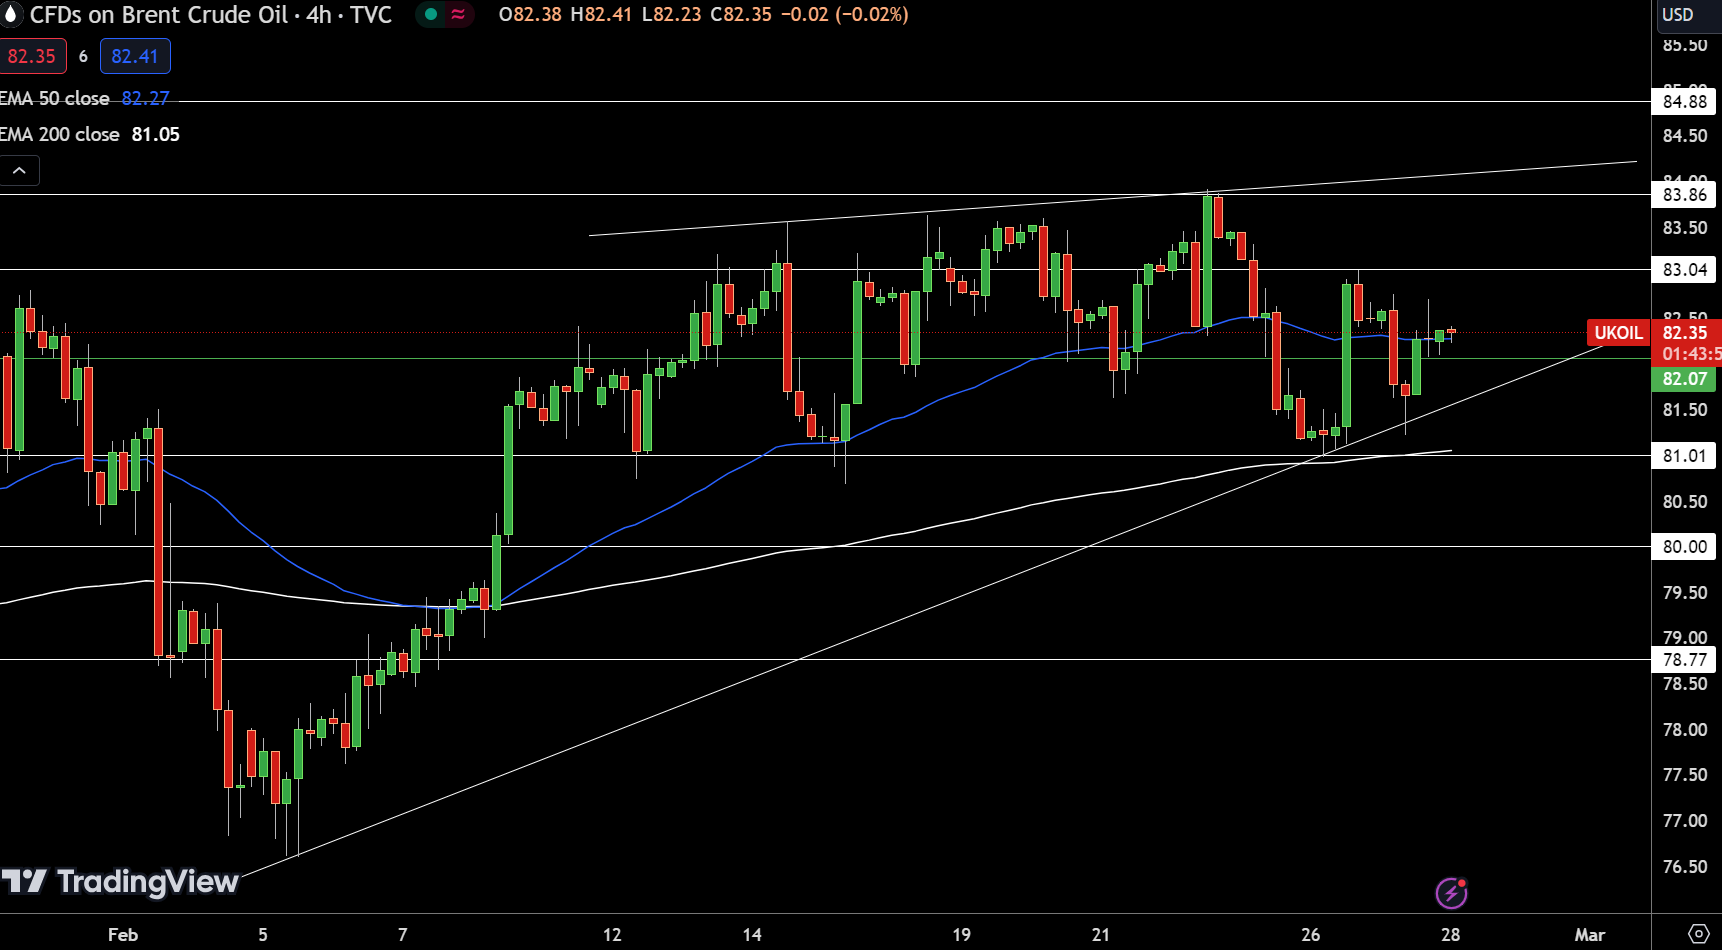
Brent crude rose 0.07 percent to $82.33 mark, underscoring investor’s cautious faith. Based on the 4-hour time frame, the crucial reference has been fixed at $82.07 mark. Pushing over this milestone might imply more positive traction. Following obstacles located at $83.04, $83.86, then $84.88 areas for Brent.
On the other hand, if the oil falls, protection is well-defined around $81.01 level. With further declines towards $80.00 then $78.77 mark showing prospective regions of buildup. The 50 and 200 D- EMAs, near $82.27 & $81.05 mark, each, support the commodity’s rising trend.
A persistent advance over $82.07 level would imply the extension of the upward pattern. Yet a drop beneath that turning point would shift investor attitudes onto cautiousness. TREND – Bullish
Natural Gas Analysis

Source: TradingView & CAPTIAL.COM
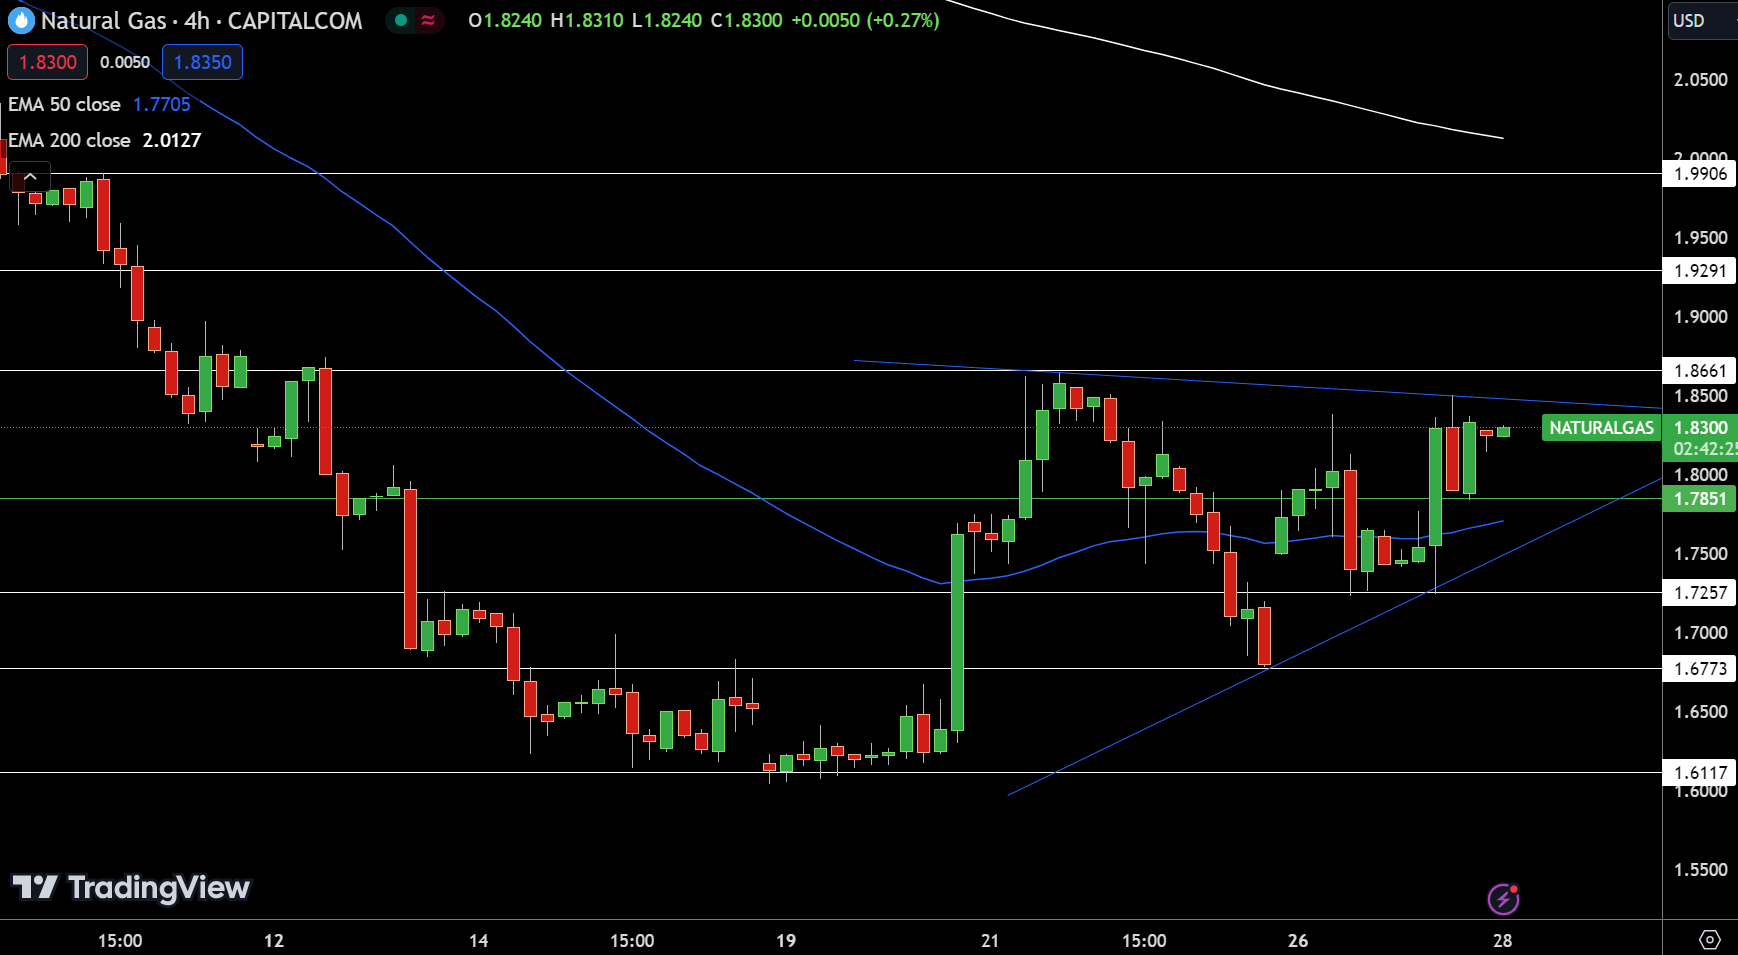
The Natural gas rates fell little, -0.16 percent, to $1.8300 mark in the trading session today. The four-hour graph shows a pivot level around $1.7851 level, showing a bull feeling over this point. Major barrier marks have been developed near $1.8661, $1.9291, then $1.9906 marks, which might possibly restrict higher momentum.
On the contrary, immediate protection is found around $1.7257, plus additionally supports around $1.6773 & $1.6117 levels. That might act as cushions in the scenario of a retreat.
The 50 and 200 D- EMAs around $1.7705 & $2.0127, accordingly, offer a positive view should values hold over the point of pivot. Implying a rising pattern for the asset.


