Crude WTI rises to around $82.80 mark on the prospect of OPEC+ continuing output and Gaza continuing un-certainty
Highlights
The Oil Price Rally: the first quarter concludes in increases as Russian production curbs alleviate world supply excess concerns.
International Issues fuel Marketplaces: Middle Eastern turmoil & OPEC policies maintain oil and petrol prices higher.
Upbeat Energy Patterns: The WTI & Brent crude oil are in robust positive trends, and have significant barriers being hit.
The Oil and NG market Snapshot
The price of crude rose over the previous trading day, bringing the fQ1 to a close with strong advancements. Boosted by expected decreases in Russia’s production. Allaying worries of a worldwide supplies glut. The limited supply scenario, impacted by output curbs from Moscow plus OPEC countries, especially Saudi aided to drive the period’s excellent growth.
The decision made by Russia to continue output restrictions, along with the effects of assaults on its petroleum facilities. Which exacerbated supply constraints. Furthermore, matters in the region of the Middle East. Notably the Gaza war with the Red Sea disturbances, boosted the price of crude.
These factors have an influence on NG and crude price estimates. Both restricted supplies and international threats potentially pushing prices higher. Markets have turned to the forthcoming OPEC conference for more guidance. However, any modifications to policies aren’t expected till the month of June.
Effect on NG and Crude Prices: Continued output cutbacks and global instability. are expected to keep prices rise Investors will keenly scrutinize OPEC’s impending choices for the future’s price motion.
WTI Crude Analysis
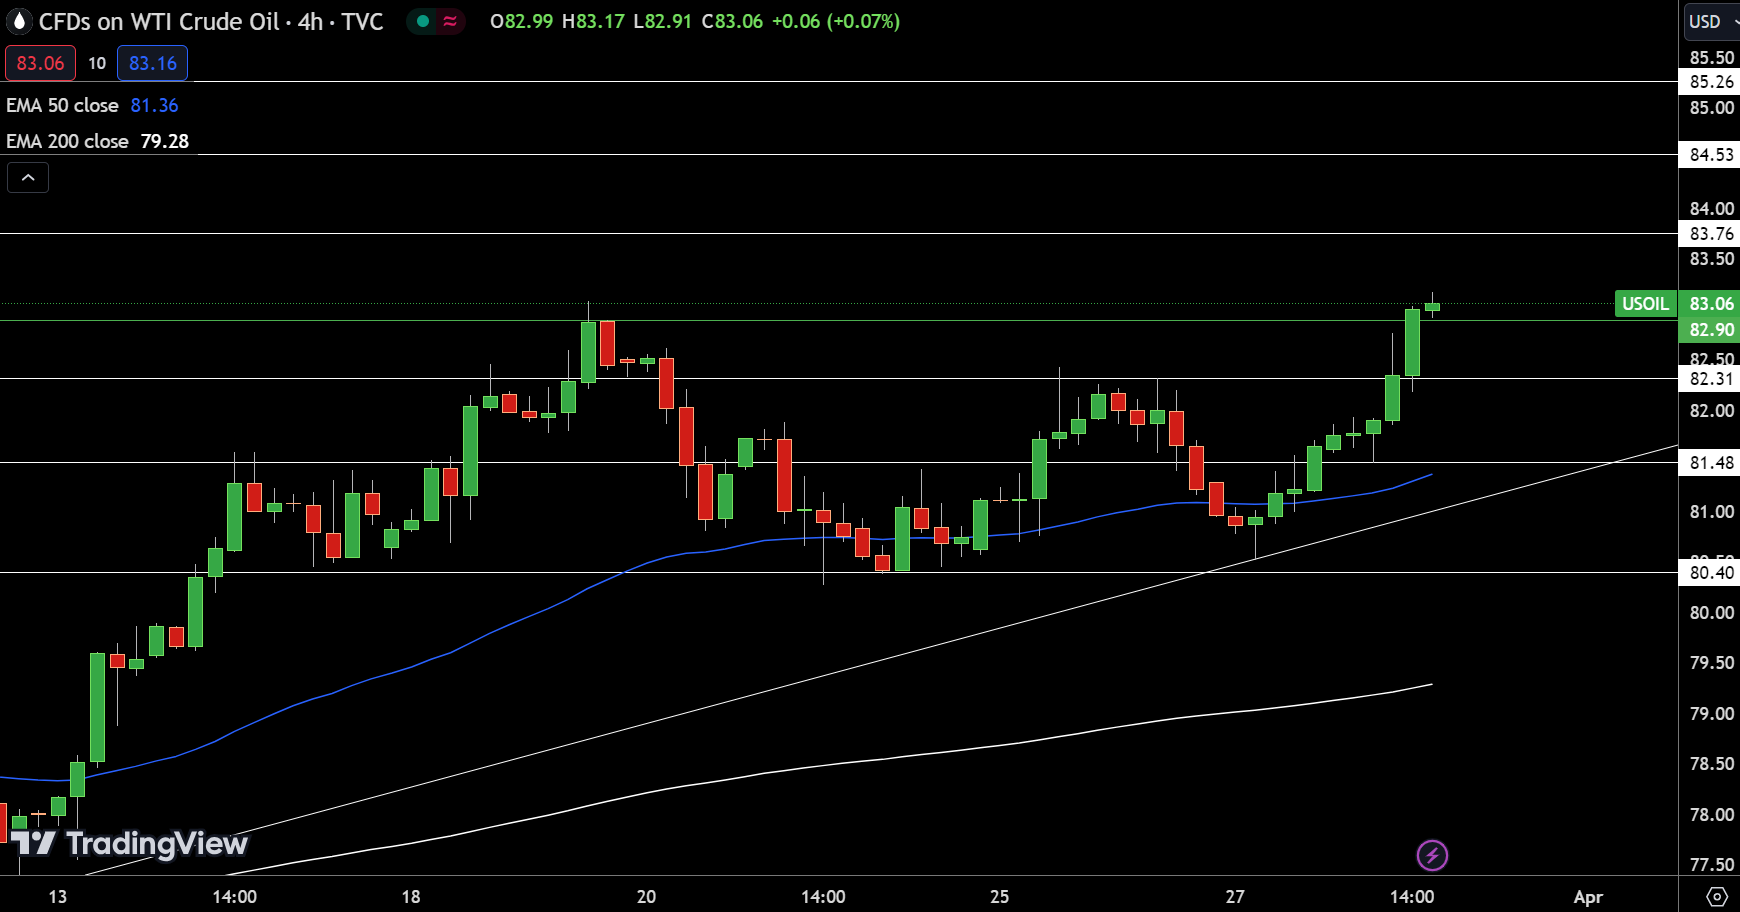
US WTI soared to $83.06 mark, up 1.73 percent. The overall market is hovering near the turning point at $82.90 mark. Alongside an excursion over possibly suggesting sustained growth.
The levels of resistance are set at $83.76, $84.53, then $85.26. Supporting marks have been created around $82.31, $81.48, then $80.40, that could buffer any downturn.

Source: TradingView
The 50 D EMA of $81.36 with the 200 D- EMA of $79.28 level both show a stronger market pattern. The general trade attitude for WTI is positive over $82.90 mark, having an associated negative risk should it falls beneath that level.
Natural Gas (NG) Analysis
The $1.7982 level is critical; surpassing it might confirm an upward trend. The resistance levels of $1.8439, $1.8759, then $1.9166 mark signal a probable higher trend.
In contrast, levels of support around $1.7208, $1.6793, & $1.6321 show bearish dangers. The 50-EMA near $1.7993 mark is roughly aligned with the price the pivot point. Implying an even market attitude. However – the 200 D- EMA of $1.8801 level signals longer-term promise. In general, the outlook is positive over $1.7982 mark, yet a drop beneath this point might result in a severe selling.
Daily Technical Indicators & Signals
WTI Crude oil
| Name | Value | Action |
| RSI(14) | 62.707 | Buy |
| STOCH(9,6) | 56.303 | Buy |
| STOCHRSI(14) | 67.995 | Buy |
| MACD(12,26) | 1.320 | Buy |
| ADX(14) | 28.688 | Buy |
| Williams %R | -10.340 | Overbought*Caution |
| Name | Value | Action |
| CCI(14) | 98.1274 | Buy |
| ATR(14) | 1.6229 | Less Volatility |
| Highs/Lows(14) | 1.4429 | Buy |
| Ultimate Oscillator | 54.885 | Buy*Caution |
| ROC | 6.550 | Buy |
| Bull/Bear Power(13) | 2.2260 | Buy |
Natural Gas (NG)
| Name | Value | Action |
| RSI(14) | 49.123 | Neutral |
| STOCH(9,6) | 57.799 | Buy |
| STOCHRSI(14) | 100.000 | Overbought*Caution |
| MACD(12,26) | -0.060 | Sell |
| ADX(14) | 41.578 | Sell |
| Williams %R | -25.000 | Buy |
| Name | Value | Action |
| CCI(14) | 60.5673 | Buy |
| ATR(14) | 0.1064 | Less Volatility |
| Highs/Lows(14) | 0.0000 | Neutral |
| Ultimate Oscillator | 47.251 | Sell |
| ROC | -2.992 | Sell |
| Bull/Bear Power(13) | 0.0730 | Buy |


