The cost of crude rose slightly on Monday, following an uptrend from the previous week, pushed by tighter availability fears.
Crude & NG Highlights
Soaring crude prices in Asian imply supply constraints, which are worsened by strikes on Russian facilities.
Strategic concerns and the conclusion of the Fed meet might influence rates of interest, affecting consumption and market projections.
A rise in NG prices to $1.83 mark signals an imminent market attitude change, with major support and resistance areas underlined.
The market Snapshot
The price of crude rose slightly in Asian trade on Monday, extending the upward trajectory begun a week ago. Spurred by tighter supplies fears and exacerbated by strikes on Russian energy installations.
Traders are eagerly watching issues in the Middle Eastern area, and the conclusion of the central bank’s gathering. Which might impact the rate of interest as well result in consumption.
These shifts, together with an increased demand estimate from the IEA. That imply a varied influence of both the Gas and Crude predictions, showing a prudent but hopeful market sentiment.
WTI Crude oil Analysis
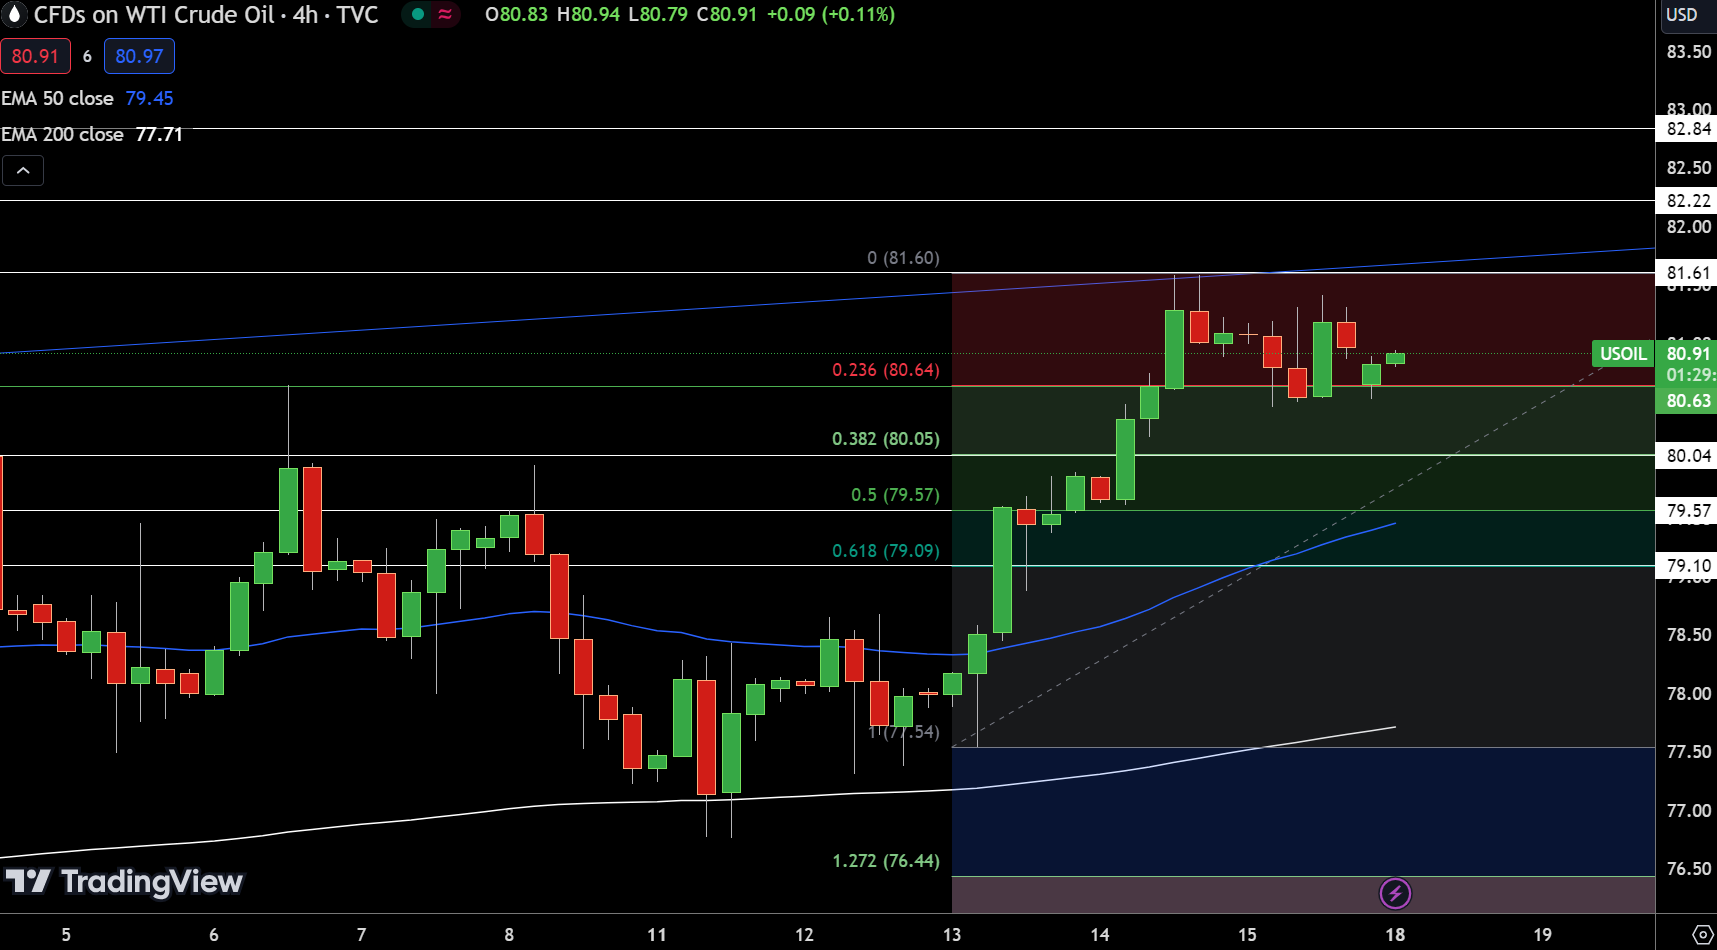
Today on Mar 18, WTI fell 0.06 percent and closed at $80.91. The market moves near the turning point of $80.63 mark. Showing a tentatively bullish perspective.
The level of resistance lurk around $81.61, $82.22, then $82.84 marks which might limit the price rise. In contrast, protection is formed at $80.04 level, with further flooring at $79.57 & $79.10 acting as cushions from losses.
The 50 D-EMA around $79.45 & the 200 D- EMA @ $77.71 each indicate a positive mood. Nevertheless, a drop beneath $80.63 mark might trigger a large negative move. Highlighting a fragile equilibrium in the present market conditions.

Source: TradingView
WTI Technical Indicators & Signals
| ame | Value | Action |
|---|---|---|
| RSI(14) | 64.991 | Buy |
| STOCH(9,6) | 54.762 | Neutral |
| STOCHRSI(14) | 100.000 | Overbought* Caution |
| MACD(12,26) | 0.080 | Buy |
| ADX(14) | 31.438 | Buy |
| Williams %R | -9.184 | Overbought*Caution |
| Name | Value | Action |
|---|---|---|
| CCI(14) | 171.3746 | Buy |
| ATR(14) | 0.2071 | Less Volatility |
| Highs/Lows(14) | 0.4264 | Buy*Caution |
| Ultimate Oscillator | 53.113 | Buy |
| ROC | 0.580 | Buy*Caution |
| Bull/Bear Power(13) | 0.4580 | Buy |
Brent Oil Analysis
The Brent oil rose by 0.42 percent to $85.62 mark. The oil is approaching its pivot level at $85.66 level. Suggesting a positive move should it remains over this level. Barrier is expected at $86.43, $87.13, then $87.75 level, that may hinder higher movement.
Supporting levels at $84.74, $84.21, then $83.70 area offer a buffer from future falls. The 50 & 200 D- EMA, near $83.67 & $82.21, accordingly, support a bull view.
Still, should Brent fall under its pivot – mark, a significant move into a downward tendency may occur. Underscoring the trader’s present fragility to levels of significance.
Natural Gas Analysis
The NG rates rose by 4.38 percent to $1.83. This substantial gain pushes the underlying asset close to its pivoting point of $1.85. Implying a potential change in investor mood.
Levels of resistance have been detected around $1.88, $1.93, then $1.99 mark. Showing that the price rise may encounter roadblocks. To the negative side, there is support around $1.78 mark, then $1.72 & $1.68. Providing a buffer from further falls.
The 50 D- EMA of $1.82 with the EMA of 200 days at $1.93 provide an inconsistent image. Showing a cautious strategy. A rise over $1.85 level might imply an additional decisive bull shift. While an inability to break this mark might support a negative view.


