
Gold (XAUUSD ) Price Analysis & Trading Strategy, March 2025
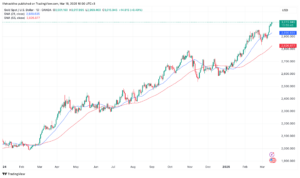
Gold (XAUUSD ) Price Analysis showing that Gold has been in a strong bullish trend, recently breaking above the psychological level of $3000. This upward momentum has been supported by smart money accumulation, strong demand zones, and bullish price action signals. However, with the Relative Strength Index (RSI) at 69.41, gold is approaching the overbought territory, signaling a possible short-term pullback before the next rally.
Understanding Key Levels: Support & Resistance
For traders looking to make informed decisions, identifying key support and resistance levels is crucial. The next major resistance lies at $3047-$3050, a level where profit-taking and potential reversals could occur. If the price breaks above this zone, the next bullish target would be $3100. On the downside, strong support is found at $2915-$2920, which aligns with a bullish order block, a level where institutional buyers have shown interest in accumulating gold. A deeper retracement could see gold testing the $2780-$2800 demand zone, providing another buying opportunity.
Trading Strategy
Buy Setup (Buying on Pullback)
Gold remains in a strong uptrend, making pullbacks a great opportunity for trend continuation trades. A potential buying zone exists around $2920-$2950, supported by an institutional order block and previous breakout retest levels. Traders looking to enter long positions should consider placing a stop loss below $2890 to minimize risk. For profit targets, a conservative exit at $3000 ensures quick gains, while holding towards $3047 and $3100 provides greater upside potential. This setup offers a risk-reward ratio (RRR) of at least 1:3, making it a favorable high-probability trade.
Sell Setup (Rejection at Resistance)
For traders considering short-term selling opportunities, a rejection at $3047-$3050 could trigger a temporary price correction. If bearish candlestick patterns such as an engulfing candle or rejection wicks form at this level, it indicates that buyers are exhausting. In such a case, a short trade entry at $3047 with a stop loss above $3070 is advisable. Profit targets for this trade include $2970 (first support) and $2920 (major demand zone), ensuring a strong risk-reward ratio.
Expected Market Movement & Time Cycles
Based on historical price action and Smart Money Concepts (SMC), gold may experience a short-term correction lasting 2-4 days before resuming its uptrend. If the $2920-$2950 zone holds, buyers will likely regain control, pushing gold towards $3050-$3100 within 1-2 weeks. However, if $2915 is broken, a deeper correction towards $2780-$2800 is possible before the next major bullish move.
Risk Management and Best Practices for Traders
To maximize trading success, risk management should be a top priority. Risking 1-2% per trade ensures longevity in the market. Additionally, traders should monitor key candlestick patterns, volume behavior, and market sentiment before entering trades. Using a trailing stop-loss after securing partial profits allows for maximum gains while minimizing risks.
Final Thoughts
Gold’s breakout above $3000 signals strong bullish momentum, but traders must be cautious as RSI nears overbought levels. The best approach is to buy the dip around $2920-$2950 or short near $3050 if rejection occurs. With strong risk management, proper entry/exit strategies, and price action confirmation, traders can capitalize on high-probability setups in the gold market.
Topics for Further Reading
- How to Use RSI in Forex Trading – Learn how to spot overbought and oversold conditions.
- Price Action Trading Strategies – A complete guide on using candlestick patterns and key levels.
- Smart Money Concepts (SMC) in Trading – Understand how institutions move the markets.
- Best Risk Management Strategies for Forex Traders – Essential tips to protect your capital.
Frequently Asked Questions (FAQs)
1. Is Gold Still in a Bullish Trend?
Yes, gold remains bullish as long as it holds above $2920. A break above $3050 could push prices toward $3100.
2. What Happens if Gold Drops Below $2920?
If gold closes below $2920, it may trigger a deeper correction toward $2780-$2800, providing another potential buying opportunity.
3. Can RSI Predict Gold’s Price Movement?
RSI is an excellent tool to confirm market momentum. Currently, at 69.41, gold is close to overbought territory, meaning a pullback is possible before continuation.
4. How Should Traders Manage Risk in Gold Trading?
Traders should risk only 1-2% per trade, set stop-loss orders properly, and use trailing stop-losses to secure profits.
5. What is the Best Timeframe for Trading Gold?
The daily timeframe provides a strong long-term trend outlook, while H1 and H4 charts are best for short-term trade setups.