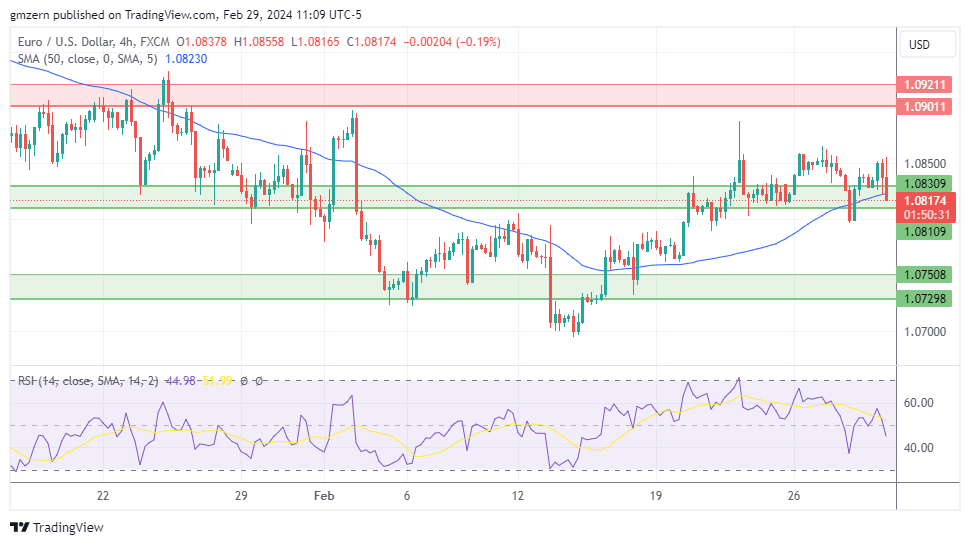
The EURUSD pair ends its three consecutive-day declining skid over 1.0800 mark. with attention on European HICP and American PMI numbers.
Fundamental Picture
At the initial European trade on Friday, the EURUSD cross snapped its 3-day losing run. Notwithstanding rising demand for the US dollar, the main currency pairing rebounds. Investors are expecting further signals from European inflation figures anticipated at the end of the day. Around the time of writing, EURUSD is trading at 1.08122, up 0.03 percent for the period in question.
Inflation in the euro area fell more this past month, prompting anticipation that the ECB could begin decreasing rate of interest from historical highs late during the year. On March 7th, the ECB will publish its rate ruling, which is likely to remain unchanged. While lowering the rate of borrowing, be sure to ensure that rising salaries are not giving rise to price inflation.
Highlighting Factors
Despite the strengthening US dollar, the EURUSD exchange rate remains strong at 1.0811 mark.
The European Central Bank is anticipated to lower its growth and inflation estimates at their March session the following week.
The United States PCE data were consistent with predictions, with Base PCE around 2.8 percent Annually in Jan.
On this Friday, traders will get a firsthand look at the European HICP with the U.S. ISM Manufacturers PMI data.
The US Jan PCE for January met forecasts, showing overall PCE at 2.4 percent annually. With Core the level of PCE around 2.8 percent YoY. The research reveals show the nation’s inflation rate is slowing much more. Yet, the US central bank policymakers are going to be patient for additional inflation figures. As well as see no cause to decrease rates. In the meantime, growing international conflicts in the region of Middle-east are expected to benefit assets that are safe such as the US currency.
Technical Indicators and Signals (Daily)
| Name | Value | Action |
| RSI(14) | 48.886 | Neutral |
| STOCH(9,6) | 58.908 | Buy |
| STOCHRSI(14) | 71.209 | Buy |
| MACD(12,26) | -0.001 | Sell |
| ADX(14) | 35.885 | Neutral |
| Williams %R | -39.332 | Buy |
| Name | Value | Action |
| CCI(14) | 34.0874 | Neutral |
| ATR(14) | 0.0052 | Less Volatility |
| Highs/Lows(14) | 0.0000 | Neutral |
| Ultimate Oscillator | 42.838 | Sell |
| ROC | 0.385 | Buy |
| Bull/Bear Power(13) | 0.0007 | Buy |
EURUSD Four Hour Graph

Source: TradingView
Key Support and Resistance Levels
S3 is 1.04479, S2 is 1.06945, S1 is 1.06945, R1 is 1.08972, R2 is 1.10455, and R3 is 1.11392.


