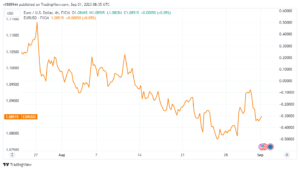
EURUSD has stabilized near 1.0850.
After Thursday’s strong fall, the EURUSD found support and stabilized near 1.0850 early Friday. If the pair reclaims 1.0900 later in the day, it may continue to rise ahead of the weekend.
Investors began to withhold pricing in another rate boost in European Central Bank (ECB) key rates in September. Causing the Euro to lose interest on Thursday. Later in the day, data from the United States revealed that the Personal Consumption Expenditures (PCE) Price Index was broadly in line. Compared to market expectations, while weekly initial jobless claims fell 2238,000 from 232,000.
Despite the fact that the chance of the Federal Reserve (Fed) holding. Its policy rate unchanged remained around 50% following these data releases. The US Dollar gained strength and weighed on EURUSD. Given the absence of movement in US T-bond yields. The USD’s recovery could be fueled by profit-taking on Thursday’s last trading day of August.
The US August jobs report could be the catalyst for the pair’s next big move.
Nonfarm Payrolls (NFP) in the United States are predicted to gain 170,000 in August. Following a less-than-expected increase of 187,000 in July. If the NFP is at or below 150,000. And fall short of the market consensus for the third consecutive month in August. The USD may see additional selling pressure, allowing the EURUSD to regain its traction.
A positive surprise, such as an NFP print above 200,000, might bolster the USD while keeping the EURUSD under bearish pressure heading into the weekend.
Later in the day, the US economic calendar will include the ISM Manufacturing PMI data. However, investors are unlikely to take positions solely on the PMI data following the US jobs news.
EURUSD Technical Analysis
The 4-hour chart’s Relative Strength Index (RSI) indicator turned flat near 50 early Friday, indicating that sellers are staying put for the time being.
On the plus side, the EURUSD is expected to rise. Strong resistance at 1.0890-1.0900, where the 4-hour chart’s 100-period Simple Moving Average (SMA) and the Fibonacci 23.6% retracement of the previous downturn intersect. A 4-hour close above that level might attract technical buyers, paving the way for a longer-term rally toward 1.0930 (static level) and 1.0960 (Fibonacci 38.2% retracement, 200-period SMA).

Looking south, the initial level of support is at 1.0840 (50-period SMA), followed by 1.0800 (psychological level) and 1.0770 (end-point of the decline).


