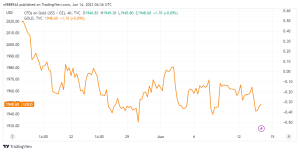
With the Consumer market Index (CPI) data from the United States (US) out of the way, the gold market is preparing for another eventful – US Federal Reserve (Fed) day. US Treasury bond yields are retreating from multi-week highs, keeping the US dollar under pressure and permitting a weak recovery in the gold market.
The Federal Reserve will take a break, but the Dot Plot will steal the show.
On Tuesday, the Bureau of Labor Statistics (BLS) reported a 0.1% increase. In the United States Consumer Price Index. for the month, lowering the annual inflation rate to 4.0% from 4.9% in April. This was the smallest 12-month gain since March 2021. Meanwhile, the Core CPI gained 0.4% month on month. And was still up 5.3% year on year, surpassing consensus estimates.
Despite a slowdown in headline Consumer Price Index data, the Core figures continue to highlight its sticky character. Implying that the US Federal Reserve may forego a rate move in June. keeping expectations of additional tightening alive and well. This viewpoint was supported by Fed fund rate futures. Which continued to suggest roughly 60% odds of a July Fed rate hike. While the US inflation report this week confirmed a standstill. The likelihood the probability of a June Fed rate rise halt increased to 95% . Following the data release, up from roughly 75% prior to the US event.
The Fed rate outlook. Which remains favorable for further tightening, underpinned a rebound in US Treasury bond rates. Throughout the curve, wiping out the US Dollar gains made in the immediate aftermath of the US CPI data release. Increased probabilities of a June Fed rate hike fueled a risk-on surge in global stocks. Contributing to a rise in US Treasury bond yields while dampening the US Dollar’s euphoria. Against this backdrop, the gold price retreated to the weekly lows near $1,940 after a brief rally to $1,971.
Gold Technical analysis
As shown on the daily chart. Following a brief battle with bulls on the release of US CPI inflation data. Gold sellers returned to the game, as the latter were unable to establish support.
After encountering new supply. Gold plummeted about $30 to threaten the crucial horizontal 100 DMA support at $1,942, which has so far protected the downside.
The 14-day Relative Strength Index (RSI) remains far below the midline. As the Fed policy announcements approach, indicating that risks remain tilted to the negative.

If the Fed hints at the end of its tightening cycle after skipping a rate hike on Wednesday, and this is reflected in the DoT Plot chart, it will be interpreted as dovish. Gold is expected to prolong its rally, breaking past the formidable 21 DMA at $1,960 and challenging the flattish 50 DMA at $1,9888.
The psychological level of $2,000 will be the next halt for gold purchasers. On the other hand, if Fed Chair Jerome Powell offers a hawkish message during his press conference, and the Dot Plot chart shows a higher terminal rate, it might imply that further Fed tightening is still on the table later this year.
In such a case, gold is likely to firmly breach the 100 DMA support at $1,942, below which the sell-off might extend to the $1,930 round number. Deeper falls are anticipated to aim for the March 17 low of $1,918.


