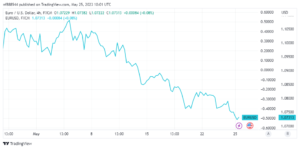
After reaching its lowest level in two months below 1.0720, the EURUSD has managed to rebound somewhat. The pair’s near-term technical outlook indicates oversold circumstances, but the Euro may struggle to outperform. The US Dollar (USD) until market sentiment improves noticeably.
A positive shift in risk sentiment might assist the Euro in finding demand.
The risk-averse market environment, along with a lack of movement in US debt-ceiling discussions, boosted the USD midweek. Furthermore, hawkish remarks from Federal Reserve (Fed) Governor Christopher Waller encouraged investors to reconsider the Fed’s decision to leave its policy rate steady in June.
Markets are presently pricing in a nearly 40% chance of one, according to the CME Group Fed Watch Tool. More rate hikes are expected in June, up from less than 20% earlier in the week. Waller reaffirmed on Wednesday that battling inflation is his primary goal, and that he would not support suspending rate hikes unless there was convincing indication that inflation was approaching the Fed’s 2% target.
The Euro Stocks50 Index is slightly higher on the day early Thursday. Stock index futures in the United States, on the other hand, indicate to a mixed start. The S&P 500 Futures are up 0.5%, but the Dow Futures are down 0.3%. If there is a risk surge following Wall Street’s opening bell, the USD may lose interest, allowing the EURUSD to rebound, and vice versa.
The first-quarter GDP report will be included on the US economic calendar. Gross Domestic Product expansion. Because this is a modification, it is unlikely to have a big market reaction. Investors will also be watching the weekly Initial Jobless Claims report. If the number of first-time claims for unemployment benefits increases dramatically, by 20K or more, the USD may see further selling pressure.
EURUSD Technical Analysis
On Thursday, the four-hour chart’s Relative Strength Index (RSI) indicator fell into oversold territory below 30.
Furthermore, EURUSD manages to stay slightly above the midpoint of the falling regression channel that began in early May.

The channel’s upper limit produces the initial resistance at 1.0750, followed by 1.0770 (static level, 20-period Simple Moving Average (SMA)) and 1.0800 (Fibonacci 50% retracement of the channel’s upper limit). 50-period SMA, most recent rise).
On the downside, 1.0700 (psychological level) is the next level of support, followed by 1.0670 (lower-limit of the channel declining channel, static level since February).


