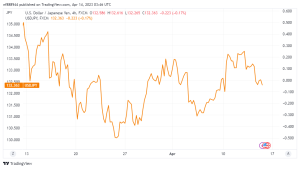
The three-day downtrend in USDJPY has faded. As has the previous day’s corrective bounce off the weekly low. USDJPY is trading near 132.40 for the third consecutive day, reversing late Thursday’s corrective bounce.
Technical Analysis
The quote’s failure to extend the previous day’s rebound beyond the 38.2%. Fibonacci retracement level of the USDJPY fall appears to be teasing the pair sellers. The bearish MACD signals and the downbeat RSI (14). Which is not oversold, add to the downside bias.
USDJPY is poised to retest the 100-SMA support level of around 132.15. However, the quote’s further weakness appears to be constrained by a three-week-long bullish trend channel. That could test the bears of the Yean pair around 131.40.

If the quote breaks the 131.40 support, the monthly low near 130.60 and the psychological magnet of 130.00 can put a stop to USDJPY sellers. before directing them to the March yearly low of 129.65.
The 38.2% Fibonacci retracement level of 132.85, on the other hand, protects the quote’s immediate upside ahead of the 200-SMA hurdle of 133.35.
However, the 50% Fibonacci retracement and the top line of the aforementioned channel, which are located near 133.85 and 134.60, respectively, may pose a challenge to Pair buyers later on.
The 61.8% Fibonacci retracement of around 134.80, also known as the golden Fibonacci ratio, as well as tops marked during March 10-15, close to 135.10-15, also act as an upside filter.
USDJPY Daily Trends
| USDJPY Daily SMA20 | 132.00 |
| Daily SMA50 | 133.42 |
| Daily SMA100 | 133.19 |
| Daily SMA200 | 137.17 |


